Verizon Wireless 2011 Annual Report Download - page 44
Download and view the complete annual report
Please find page 44 of the 2011 Verizon Wireless annual report below. You can navigate through the pages in the report by either clicking on the pages listed below, or by using the keyword search tool below to find specific information within the annual report.-
 1
1 -
2
-
3
-
4
-
5
-
6
-
7
-
8
-
9
-
10
-
11
-
12
-
13
-
14
-
15
-
16
-
17
-
18
-
19
-
20
-
21
-
22
-
23
-
24
-
25
-
26
-
27
-
28
-
29
-
30
-
31
-
32
-
33
-
 34
34 -
 35
35 -
 36
36 -
 37
37 -
 38
38 -
 39
39 -
 40
40 -
 41
41 -
 42
42 -
 43
43 -
 44
44 -
 45
45 -
 46
46 -
 47
47 -
 48
48 -
 49
49 -
 50
50 -
 51
51 -
 52
52 -
 53
53 -
 54
54 -
55
-
56
-
57
-
58
-
59
-
60
-
61
-
62
-
63
-
64
-
65
-
66
-
67
-
68
-
69
-
70
-
71
-
72
-
73
-
74
-
75
-
76
-
77
-
78
-
79
-
80
-
81
-
82
-
83
-
84
-
85
-
86
-
87
-
88
 |
 |

42
requirements. Securities ratings assigned by rating organizations are
expressions of opinion and are not recommendations to buy, sell, or hold
securities. A securities rating is subject to revision or withdrawal at any
time by the assigning rating organization. Each rating should be evalu-
ated independently of any other rating.
Covenants
Our credit agreements contain covenants that are typical for large,
investment grade companies. These covenants include requirements to
pay interest and principal in a timely fashion, pay taxes, maintain insur-
ance with responsible and reputable insurance companies, preserve our
corporate existence, keep appropriate books and records of financial
transactions, maintain our properties, provide financial and other reports
to our lenders, limit pledging and disposition of assets and mergers and
consolidations, and other similar covenants.
We and our consolidated subsidiaries are in compliance with all debt
covenants.
Increase (Decrease) In Cash and Cash Equivalents
Our Cash and cash equivalents at December 31, 2011 totaled $13.4 bil-
lion, a $6.7 billion increase compared to Cash and cash equivalents at
December 31, 2010 for the reasons discussed above. Our Cash and cash
equivalents at December 31, 2010 totaled $6.7 billion, a $4.7 billion
increase compared to Cash and cash equivalents at December 31, 2009
for the reasons discussed above.
As of December 31, 2011, Verizon Wireless cash and cash equivalents and
debt outstanding totaled $12.3 billion and $11.6 billion, respectively.
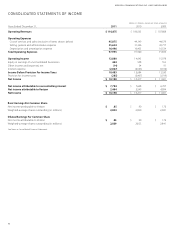
Free Cash Flow
Free cash flow is a non-GAAP financial measure that management
believesisusefultoinvestorsandotherusersofVerizon’sfinancialinfor-
mationinevaluatingcashavailabletopaydebtanddividends.Freecash
flow is calculated by subtracting capital expenditures from net cash
provided by operating activities. The following table reconciles net cash
providedbyoperatingactivitiestoFreecashflow:
(dollars in millions)
Years Ended December 31, 2011 2010 2009
Net cash provided by operating activities $ 29,780 $ 33,363 $ 31,390
Less Capital expenditures (including
capitalized software) 16,244 16,458 16,872
Free cash flow $ 13,536 $ 16,905 $ 14,518
The changes in free cash flow during 2011, 2010 and 2009 were a result
of the factors described in connection with net cash provided by oper-
ating activities and capital expenditures above.
Employee Benefit Plan Funded Status and Contributions
We operate numerous qualified and nonqualified pension plans and
other postretirement benefit plans. These plans primarily relate to our
domestic business units. During 2011 and 2009, we contributed $0.4 bil-
lion and $0.2 billion, respectively, to our qualified pension plans. During
2010, contributions to our qualified pension plans were not significant.
We also contributed $0.1 billion to our nonqualified pension plans in
2011, 2010 and 2009, respectively.
In an effort to reduce the risk of our portfolio strategy and better align
assets with liabilities, we are shifting our strategy to one that is more
liability driven, where cash flows from investments better match pro-
jected benefit payments but result in lower asset returns. We intend to
InJuly2011,theBoardofRepresentativesofVerizonWirelessdeclareda
distribution to its owners, payable on January 31, 2012 in proportion to
their partnership interests on that date, in the aggregate amount of $10
billion. As a result, during January 2012, Vodafone Group Plc received a
cash payment of $4.5 billion and the remainder of the distribution was
received by Verizon.
Dividends
During 2011, we paid $5.6 billion in dividends compared to $5.4 billion
in 2010 and $5.3 billion in 2009. As in prior periods, dividend payments
were a significant use of capital resources. The Verizon Board of Directors
determines the appropriateness of the level of our dividend payments
on a periodic basis by considering such factors as long-term growth
opportunities, internal cash requirements and the expectations of our
shareowners. During the third quarter of 2011, the Board increased our
quarterly dividend payment 2.6% to $.50 per share from $.4875 per share
inthesameperiodof2010.ThisisthefifthconsecutiveyearthatVerizon’s
Board of Directors has approved a quarterly dividend increase. During
the third quarter of 2010, the Board increased our quarterly dividend pay-
ment 2.6% to $.4875 per share from $.475 per share in the same period of
2009. During the third quarter of 2009, the Board increased our dividend
payments 3.3%.
Credit Facility
As of December 31, 2011, the unused borrowing capacity under a $6.2
billion three-year credit facility with a group of major financial institu-
tions was approximately $6.1 billion. On April 15, 2011, we amended
this facility primarily to reduce fees and borrowing costs and extend the
maturity date to October 15, 2014. The credit facility does not require us
to comply with financial covenants or maintain specified credit ratings,
and it permits us to borrow even if our business has incurred a mate-
rial adverse change. We use the credit facility to support the issuance
of commercial paper, for the issuance of letters of credit and for general
corporate purposes.
Verizon’sratioofnetdebttoConsolidatedAdjustedEBITDAwas1.2x
at December 31, 2011 and 1.3x at December 31, 2010. Consolidated
Adjusted EBITDA excludes the effects of non-operational items (see
“OtherItems”).
Common Stock
Common stock has been used from time to time to satisfy some of the
fundingrequirementsofemployeeandshareownerplans.OnFebruary3,
2011, the Board of Directors replaced the current share buyback program
with a new program for the repurchase of up to 100 million common
sharesterminatingnolaterthanthecloseofbusinessonFebruary28,
2014. The Board also determined that no additional shares were to be
purchased under the prior program.
During the first quarter of 2009, we entered into a privately negotiated
prepaid forward agreement for 14 million shares of Verizon common
stock at a cost of approximately $0.4 billion. We terminated the prepaid
forward agreement with respect to 5 million of the shares during the
fourth quarter of 2009 and 9 million of the shares in the first quarter of
2010, which resulted in the delivery of those shares to Verizon.
There were no repurchases of common stock during 2011, 2010 or 2009.
Credit Ratings
The debt securities of Verizon Communications and its subsidiaries con-
tinue to be accorded high ratings by the three primary rating agencies.
Although a one-level ratings downgrade would not be expected to sig-
nificantly impact our access to capital, it could increase both the cost
of refinancing existing debt and the cost of financing any new capital
ManagEMEnt’s discussiOn and analYsis
OF Financial cOnditiOn and REsults OF OPERatiOns continued