Verizon Wireless 2011 Annual Report Download - page 33
Download and view the complete annual report
Please find page 33 of the 2011 Verizon Wireless annual report below. You can navigate through the pages in the report by either clicking on the pages listed below, or by using the keyword search tool below to find specific information within the annual report.-
 1
1 -
2
-
3
-
4
-
5
-
6
-
7
-
8
-
9
-
10
-
11
-
12
-
13
-
14
-
15
-
16
-
17
-
18
-
19
-
20
-
21
-
22
-
 23
23 -
 24
24 -
 25
25 -
 26
26 -
 27
27 -
 28
28 -
 29
29 -
 30
30 -
 31
31 -
 32
32 -
 33
33 -
 34
34 -
 35
35 -
 36
36 -
 37
37 -
 38
38 -
 39
39 -
 40
40 -
 41
41 -
 42
42 -
 43
43 -
44
-
45
-
46
-
47
-
48
-
49
-
50
-
51
-
52
-
53
-
54
-
55
-
56
-
57
-
58
-
59
-
60
-
61
-
62
-
63
-
64
-
65
-
66
-
67
-
68
-
69
-
70
-
71
-
72
-
73
-
74
-
75
-
76
-
77
-
78
-
79
-
80
-
81
-
82
-
83
-
84
-
85
-
86
-
87
-
88
 |
 |

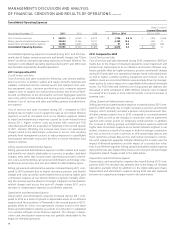
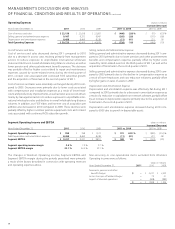
Non-operational Charges
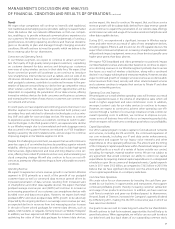
Non-operational charges included in operating expenses were as follows:
(dollars in millions)
Years Ended December 31, 2011 2010 2009
Severance, Pension and Benefit Charges
Cost of services and sales $ – $ 1,723 $ 1,443
Selling, general and administrative expense 5,954 1,331 (3)
5,954 3,054 1,440
Merger Integration and Acquisition
Related Charges
Cost of services and sales – 376 195
Selling, general and administrative expense – 389 442
Depreciation and amortization expense – 102 317
– 867 954
Access Line Spin-off Related Charges
Cost of services and sales – 42 38
Selling, general and administrative expense – 365 415
– 407 453
Total non-operating charges included in
operating expenses $ 5,954 $ 4,328 $ 2,847
See“OtherItems”foradescriptionofothernon-operationalitems.
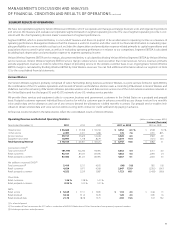
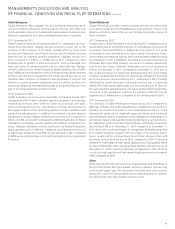
Consolidated Operating Income and EBITDA
Consolidated earnings before interest, taxes, depreciation and
amortization expenses (Consolidated EBITDA) and Consolidated
Adjusted EBITDA, which are presented below, are non-GAAP measures
and do not purport to be alternatives to operating income as a measure
ofoperatingperformance.Managementbelievesthatthesemeasures
are useful to investors and other users of our financial information in
evaluating operating profitability on a more variable cost basis as they
exclude the depreciation and amortization expense related primarily
31
to capital expenditures and acquisitions that occurred in prior years,
as well as in evaluating operating performance in relation to our
competitors. Consolidated EBITDA is calculated by adding back interest,
taxes, depreciation and amortization expense, equity in earnings of
unconsolidated businesses and other income and (expense), net to net
income. Consolidated Adjusted EBITDA is calculated by excluding the
effect of non-operational items and the impact of divested operations
from the calculation of Consolidated EBITDA.
Itismanagement’sintenttoprovidenon-GAAPfinancialinformationto
enhancetheunderstandingofVerizon’sGAAPfinancialinformation,and
it should be considered by the reader in addition to, but not instead of,
the financial statements prepared in accordance with GAAP. Each non-
GAAP financial measure is presented along with the corresponding GAAP
measure so as not to imply that more emphasis should be placed on the
non-GAAP measure. The non-GAAP financial information presented may
be determined or calculated differently by other companies.
(dollars in millions)
Years Ended December 31, 2011 2010 2009
Consolidated Operating Income $ 12,880 $ 14,645 $ 15,978
Add Depreciation and amortization
expense 16,496 16,405 16,534
Consolidated EBITDA 29,376 31,050 32,512
Add Non-operating charges included in
operating expenses(1) 5,954 4,226 2,530
Add Deferred revenue adjustment – 268 –
Less Impact of divested operations(1) – (1,168) (2,653)
Consolidated Adjusted EBITDA $ 35,330 $ 34,376 $ 32,389
(1) Excludes non-operating charges included in Depreciation and amortization expense.
ManagEMEnt’s discussiOn and analYsis
OF Financial cOnditiOn and REsults OF OPERatiOns continued
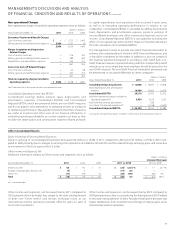
Other Consolidated Results
Equity in Earnings of Unconsolidated Businesses
Equity in earnings of unconsolidated businesses decreased $64 million, or 12.6%, in 2011 compared to 2010 and $45 million, or 8.1%, in 2010 com-
pared to 2009 primarily due to changes in earnings from operations at Vodafone Omnitel N.V. and the related foreign exchange gains and losses due
to movements of the Euro against the U.S. dollar.
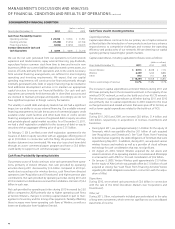
Other Income and (Expense), Net
Additional information relating to Other income and (expense), net is as follows:
(dollars in millions)
Increase/(Decrease)
Years Ended December 31, 2011 2010 2009 2011 vs. 2010 2010 vs. 2009
Interest income $ 68 $ 92 $ 75 $ (24) (26.1)% $ 17 22.7 %
Foreignexchangegains(losses),net (9) 5 – (14) nm 5 –
Other, net (73) (43) 16 (30) 69.8 (59) nm
Total $ (14) $ 54 $ 91 $ (68) nm $ (37) (40.7)
nm – not meaningful
Other income and (expense), net decreased during 2011 compared to
2010 primarily driven by higher fees related to the early extinguishment
of debt (see “Other Items”) and foreign exchange losses at our
international wireline operations, partially offset by gains on sales of
short-term investments.
Other income and (expense), net decreased during 2010 compared to
2009 primarily due to fees incurred during the third quarter of 2010 related
to the early extinguishment of debt. Partially offsetting the decrease was
higher distributions from investments and foreign exchange gains at our
international wireline operations.