Verizon Wireless 2011 Annual Report Download - page 80
Download and view the complete annual report
Please find page 80 of the 2011 Verizon Wireless annual report below. You can navigate through the pages in the report by either clicking on the pages listed below, or by using the keyword search tool below to find specific information within the annual report.-
 1
1 -
2
-
3
-
4
-
5
-
6
-
7
-
8
-
9
-
10
-
11
-
12
-
13
-
14
-
15
-
16
-
17
-
18
-
19
-
20
-
21
-
22
-
23
-
24
-
25
-
26
-
27
-
28
-
29
-
30
-
31
-
32
-
33
-
34
-
35
-
36
-
37
-
38
-
39
-
40
-
41
-
42
-
43
-
44
-
45
-
46
-
47
-
48
-
49
-
50
-
51
-
52
-
53
-
54
-
55
-
56
-
57
-
58
-
59
-
60
-
61
-
62
-
63
-
64
-
65
-
66
-
67
-
68
-
69
-
 70
70 -
 71
71 -
 72
72 -
 73
73 -
 74
74 -
 75
75 -
 76
76 -
 77
77 -
 78
78 -
 79
79 -
 80
80 -
 81
81 -
 82
82 -
 83
83 -
 84
84 -
 85
85 -
 86
86 -
 87
87 -
 88
88
 |
 |

78
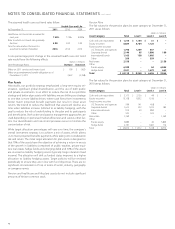
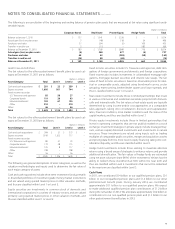
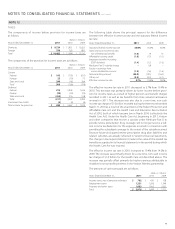
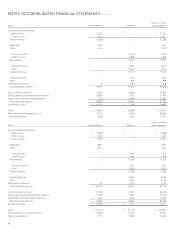
nOtEs tO cOnsOlidatEd Financial statEMEnts continued
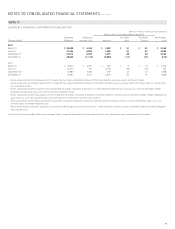
(dollars in millions)
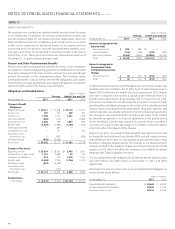
2010 Verizon Wireless Wireline Total Segments
External Operating Revenues
Retail service $ 53,267 $ – $ 53,267
Other service 2,321 – 2,321
Service revenue 55,588 – 55,588
Equipment 4,412 – 4,412
Other 3,341 – 3,341
Consumer retail – 13,419 13,419
Small business – 2,828 2,828
Mass Markets – 16,247 16,247
Strategic services – 6,602 6,602
Other – 8,712 8,712
Global Enterprise – 15,314 15,314
Global Wholesale – 7,526 7,526
Other – 858 858
Intersegment revenues 66 1,282 1,348
Total operating revenues 63,407 41,227 104,634
Cost of services and sales 19,245 22,618 41,863
Selling, general and administrative expense 18,082 9,372 27,454
Depreciation and amortization expense 7,356 8,469 15,825
Total operating expenses 44,683 40,459 85,142
Operating income $ 18,724 $ 768 $ 19,492
Assets $ 138,863 $ 83,849 $ 222,712
Plant, property and equipment, net 32,253 54,594 86,847
Capital expenditures 8,438 7,269 15,707
(dollars in millions)
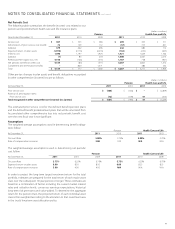
2009 Verizon Wireless Wireline Total Segments
External Operating Revenues
Retail service $ 50,688 $ – $ 50,688
Other service 1,287 – 1,287
Service revenue 51,975 – 51,975
Equipment 4,837 – 4,837
Other 3,413 – 3,413
Consumer retail – 13,205 13,205
Small business – 2,904 2,904
Mass Markets – 16,109 16,109
Strategic services – 6,191 6,191
Other – 9,097 9,097
Global Enterprise – 15,288 15,288
Global Wholesale – 8,336 8,336
Other – 1,443 1,443
Intersegment revenues 100 1,275 1,375
Total operating revenues 60,325 42,451 102,776
Cost of services and sales 19,348 22,693 42,041
Selling, general and administrative expense 17,309 9,947 27,256
Depreciation and amortization expense 7,030 8,238 15,268
Total operating expenses 43,687 40,878 84,565
Operating income $ 16,638 $ 1,573 $ 18,211
Assets $ 135,162 $ 91,778 $ 226,940
Plant, property and equipment, net 30,849 59,373 90,222
Capital expenditures 7,152 8,892 16,044