Verizon Wireless 2011 Annual Report Download - page 32
Download and view the complete annual report
Please find page 32 of the 2011 Verizon Wireless annual report below. You can navigate through the pages in the report by either clicking on the pages listed below, or by using the keyword search tool below to find specific information within the annual report.-
 1
1 -
2
-
3
-
4
-
5
-
6
-
7
-
8
-
9
-
10
-
11
-
12
-
13
-
14
-
15
-
16
-
17
-
18
-
19
-
20
-
21
-
 22
22 -
 23
23 -
 24
24 -
 25
25 -
 26
26 -
 27
27 -
 28
28 -
 29
29 -
 30
30 -
 31
31 -
 32
32 -
 33
33 -
 34
34 -
 35
35 -
 36
36 -
 37
37 -
 38
38 -
 39
39 -
 40
40 -
 41
41 -
 42
42 -
43
-
44
-
45
-
46
-
47
-
48
-
49
-
50
-
51
-
52
-
53
-
54
-
55
-
56
-
57
-
58
-
59
-
60
-
61
-
62
-
63
-
64
-
65
-
66
-
67
-
68
-
69
-
70
-
71
-
72
-
73
-
74
-
75
-
76
-
77
-
78
-
79
-
80
-
81
-
82
-
83
-
84
-
85
-
86
-
87
-
88
 |
 |

2010 Compared to 2009
Cost of Services and Sales
Cost of services and sales decreased during 2010 compared to 2009 pri-
marily due to the impact of divested operations, lower headcount and
productivity improvements at our Wireline and Verizon Wireless seg-
ments, partially offset by higher severance, pension and benefit charges
during 2010 and other non-operational charges noted in the table below
as well as higher customer premise equipment and content costs. In
addition, lower access costs at Wireline were primarily driven by manage-
ment actions to reduce exposure to unprofitable international wholesale
routes.OurFiOSVideoandInternetcostofacquisitionperadditionalso
decreased in 2010 compared to 2009. Wireless network costs increased
as a result of an increase in local interconnection cost and increases in
roaming costs.
Selling, General and Administrative Expense
Selling, general and administrative expense increased during 2010 com-
pared to 2009 primarily due to higher severance, pension and benefit
charges, which primarily included a pension and postretirement ben-
efit plan remeasurement loss in 2010 compared to a remeasurement
gain in 2009, as well as the charges in connection with an agreement
reached with certain unions on temporary enhancements. In addition,
the increase in Selling, general and administrative expense reflected
higher sales commission expense at our Verizon Wireless segment in our
indirect channel as a result of increases in both the average commission
per unit, as the mix of units continues to shift toward data devices and
more customers activate data service, and contract renewals in connec-
tion with equipment upgrades. Partially offsetting the increase was the
impact of divested operations and the impact of cost reduction initia-
tives in our Wireline segment. Selling, general and administrative expense
during 2010 was also impacted by lower access line spin-off and merger
integration related charges noted in the table below.
Depreciation and Amortization Expense
Depreciation and amortization expense decreased during 2010 com-
pared to 2009. The decrease was primarily due to the impact of divested
operations, partially offset by additions to the depreciable asset base.
Depreciation and amortization expense during 2010 was also impacted
by lower non-operational charges noted in the table below.
30
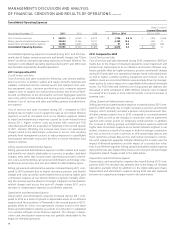
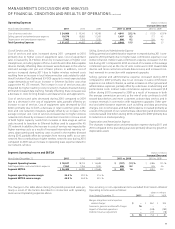
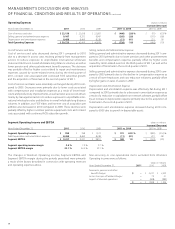
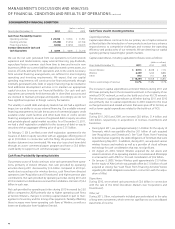
Consolidated Operating Expenses
(dollars in millions)
Increase/(Decrease)
Years Ended December 31, 2011 2010 2009 2011 vs. 2010 2010 vs. 2009
Cost of services and sales $ 45,875 $ 44,149 $ 44,579 $ 1,726 3.9 % $ (430) (1.0)%
Selling, general and administrative expense 35,624 31,366 30,717 4,258 13.6 649 2.1
Depreciation and amortization expense 16,496 16,405 16,534 91 0.6 (129) (0.8)
Consolidated Operating Expenses $ 97,995 $ 91,920 $ 91,830 $ 6,075 6.6 $ 90 0.1
Consolidated operating expenses increased during 2011 and 2010 pri-
marilyduetohigherseverance,pensionandbenefitcharges(see“Other
Items”)aswellasincreasedoperatingexpensesatVerizonWireless.The
changes in consolidated operating expenses during 2011 and 2010 were
also favorably impacted by divested operations.
2011 Compared to 2010
Cost of Services and Sales
Cost of services and sales includes the following costs directly attribut-
able to a service or product: salaries and wages, benefits, materials and
supplies, contracted services, network access and transport costs, wire-
less equipment costs, customer provisioning costs, computer systems
support, costs to support our outsourcing contracts and technical facili-
tiesandcontributionstotheUniversalServiceFund.Aggregatecustomer
care costs, which include billing and service provisioning, are allocated
between Cost of services and sales and Selling, general and administra-
tive expense.
Cost of services and sales increased during 2011 compared to 2010
primarily due to higher cost of equipment sales at our Verizon Wireless
segment, as well as increased costs at our Wireline segment related
to repair and maintenance expenses caused by storm-related events
during 2011, higher content costs associated with continued FiOS
subscriber growth and the acquisition of Terremark in the second quarter
of 2011. Partially offsetting the increase were lower non-operational
charges noted in the table below, a decrease in access costs resulting
primarily from management actions to reduce exposure to unprofitable
international wholesale routes and declines in overall wholesale long
distance volumes.
Selling, General and Administrative Expense
Selling, general and administrative expense includes: salaries and wages
and benefits not directly attributable to a service or product; bad debt
charges; taxes other than income taxes; advertising and sales commis-
sion costs; customer billing; call center and information technology costs;
professional service fees; and rent and utilities for administrative space.
Selling, general and administrative expense increased during 2011 com-
pared to 2010 primarily due to higher severance, pension and benefit
charges and costs caused by storm-related events as well as higher sales
commission expense at our Verizon Wireless segment. Partially offset-
ting the increase was the absence of merger integration and acquisition
related charges and access line spin-off charges during 2011 and a
decrease in compensation expense at our Wireline segment.
Depreciation and Amortization Expense
Depreciation and amortization expense increased during 2011 com-
pared to 2010 as a result of growth in depreciable assets at our Wireless
segment and the acquisition of Terremark in the second quarter of 2011,
partially offset by lower non-operational charges noted in the table
below and amortization expense as a result of a reduction in capitalized
non-network software at our Wireline segment. The change in depre-
ciation and amortization expense was also partially attributable to the
impact of divested operations.
ManagEMEnt’s discussiOn and analYsis
OF Financial cOnditiOn and REsults OF OPERatiOns continued