Verizon Wireless 2011 Annual Report Download - page 40
Download and view the complete annual report
Please find page 40 of the 2011 Verizon Wireless annual report below. You can navigate through the pages in the report by either clicking on the pages listed below, or by using the keyword search tool below to find specific information within the annual report.-
 1
1 -
2
-
3
-
4
-
5
-
6
-
7
-
8
-
9
-
10
-
11
-
12
-
13
-
14
-
15
-
16
-
17
-
18
-
19
-
20
-
21
-
22
-
23
-
24
-
25
-
26
-
27
-
28
-
29
-
 30
30 -
 31
31 -
 32
32 -
 33
33 -
 34
34 -
 35
35 -
 36
36 -
 37
37 -
 38
38 -
 39
39 -
 40
40 -
 41
41 -
 42
42 -
 43
43 -
 44
44 -
 45
45 -
 46
46 -
 47
47 -
 48
48 -
 49
49 -
 50
50 -
51
-
52
-
53
-
54
-
55
-
56
-
57
-
58
-
59
-
60
-
61
-
62
-
63
-
64
-
65
-
66
-
67
-
68
-
69
-
70
-
71
-
72
-
73
-
74
-
75
-
76
-
77
-
78
-
79
-
80
-
81
-
82
-
83
-
84
-
85
-
86
-
87
-
88
 |
 |

38
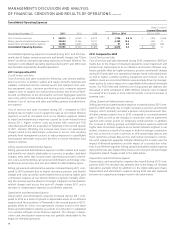
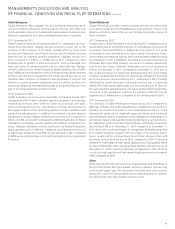
Operating Expenses (dollars in millions)
Increase/(Decrease)
Years Ended December 31, 2011 2010 2009 2011 vs. 2010 2010 vs. 2009
Cost of services and sales $ 22,158 $ 22,618 $ 22,693 $ (460) (2.0)% $ (75) (0.3) %
Selling, general and administrative expense 9,107 9,372 9,947 (265) (2.8) (575) (5.8)
Depreciation and amortization expense 8,458 8,469 8,238 (11) (0.1) 231 2.8
Total Operating Expenses $ 39,723 $ 40,459 $ 40,878 $ (736) (1.8) $ (419) (1.0)
Selling, General and Administrative Expense
Selling, general and administrative expense decreased during 2011 com-
pared to 2010 primarily due to lower pension and other postretirement
benefits and compensation expense, partially offset by higher costs
caused by storm-related events in the third quarter of 2011, as well as the
acquisition of Terremark in the second quarter of 2011.
Selling, general and administrative expense decreased during 2010 com-
pared to 2009 primarily due to the decline in compensation expense as
a result of lower headcount and cost reduction initiatives, partially offset
by higher gains on sales of assets in 2009.
Depreciation and Amortization Expense
Depreciation and amortization expense was effectively flat during 2011
compared to 2010 primarily due to a decrease in amortization expense as
a result of a reduction in capitalized non-network software, partially offset
by an increase in depreciation expense primarily due to the acquisition of
Terremark in the second quarter of 2011.
Depreciation and amortization expense increased during 2010 com-
pared to 2009 due to growth in depreciable assets.
Cost of Services and Sales
Cost of services and sales decreased during 2011 compared to 2010
due to a decrease in access costs resulting primarily from management
actions to reduce exposure to unprofitable international wholesale
routes and declines in overall wholesale long distance volumes, as well as
lower pension and other postretirement benefit expenses. The decrease
was partially offset by higher costs related to repair and maintenance
expenses caused by storm-related events during the third quarter of
2011,contentcostsassociatedwithcontinuedFiOSsubscribergrowth
and the acquisition of Terremark in the second quarter of 2011.
Cost of services and sales were essentially unchanged during 2010 com-
pared to 2009. Decreases were primarily due to lower costs associated
with compensation and installation expenses as a result of lower head-
count and productivity improvements, as well as lower access costs driven
mainly by management actions to reduce exposure to unprofitable inter-
national wholesale routes and declines in overall wholesale long distance
volumes.Inaddition,ourFiOSVideoandInternetcostofacquisitionper
addition also decreased in 2010 compared to 2009. These declines were
partially offset by higher customer premise equipment costs and content
costsassociatedwithcontinuedFiOSsubscribergrowth.
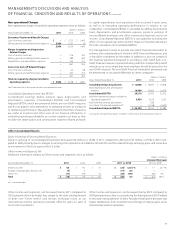
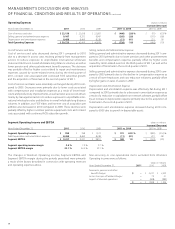
Segment Operating Income and EBITDA (dollars in millions)
Increase/(Decrease)
Years Ended December 31, 2011 2010 2009 2011 vs. 2010 2010 vs. 2009
Segment Operating Income $ 959 $ 768 $ 1,573 $ 191 24.9 % $ (805) (51.2)%
Add Depreciation and amortization expense 8,458 8,469 8,238 (11) (0.1) 231 2.8
Segment EBITDA $ 9,417 $ 9,237 $ 9,811 $ 180 1.9 $ (574) (5.9)
Segment operating income margin 2.4 % 1.9 % 3.7 %
Segment EBITDA margin 23.1 % 22.4 % 23.1 %
The changes inWireline’s Operating income, Segment EBITDA and
Segment EBITDA margin during the periods presented were primarily
a result of the factors described in connection with operating revenues
and operating expenses above.
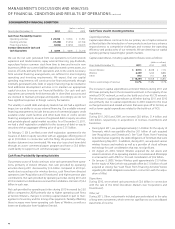
Non-recurring or non-operational items excluded from Wireline’s
Operating income were as follows:
(dollars in millions)
Years Ended December 31, 2011 2010 2009
Severance, pension and other
benefit charges $ – $ 2,237 $ 2,253
Access line spin-off related charges – 79 51
Impact of divested operations – (408) (980)
$ – $ 1,908 $ 1,324
ManagEMEnt’s discussiOn and analYsis
OF Financial cOnditiOn and REsults OF OPERatiOns continued