Verizon Wireless 2011 Annual Report Download - page 27
Download and view the complete annual report
Please find page 27 of the 2011 Verizon Wireless annual report below. You can navigate through the pages in the report by either clicking on the pages listed below, or by using the keyword search tool below to find specific information within the annual report.-
 1
1 -
2
-
3
-
4
-
5
-
6
-
7
-
8
-
9
-
10
-
11
-
12
-
13
-
14
-
15
-
16
-
 17
17 -
 18
18 -
 19
19 -
 20
20 -
 21
21 -
 22
22 -
 23
23 -
 24
24 -
 25
25 -
 26
26 -
 27
27 -
 28
28 -
 29
29 -
 30
30 -
 31
31 -
 32
32 -
 33
33 -
 34
34 -
 35
35 -
 36
36 -
 37
37 -
38
-
39
-
40
-
41
-
42
-
43
-
44
-
45
-
46
-
47
-
48
-
49
-
50
-
51
-
52
-
53
-
54
-
55
-
56
-
57
-
58
-
59
-
60
-
61
-
62
-
63
-
64
-
65
-
66
-
67
-
68
-
69
-
70
-
71
-
72
-
73
-
74
-
75
-
76
-
77
-
78
-
79
-
80
-
81
-
82
-
83
-
84
-
85
-
86
-
87
-
88
 |
 |

25
sElEctEd Financial data
VERIZON COMMUNICATIONS INC. AND SUBSIDIARIES
Verizon S&P 500 Telecom Services S&P 500
Stock Performance Graph
$100
$80
$60
$40
$140
$120
$160
2006 2007 2008 2009 2010 2011
Dollars
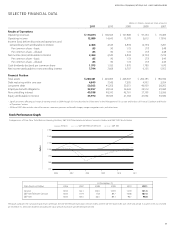
Comparison of Five-Year Total Return Among Verizon, S&P 500 Telecommunications Services Index and S&P 500 Stock Index
The graph compares the cumulative total returns of Verizon, the S&P 500 Telecommunications Services Index, and the S&P 500 Stock Index over a five-year period. It assumes $100 was invested
on December 31, 2006 with dividends (including the value of each respective spin-off ) being reinvested.
Data Points in Dollars
At December 31,
2006 2007 2008 2009 2010 2011
Verizon 100.0 122.1 100.0 103.9 127.9 151.3
S&P 500 Telecom Services 100.0 111.9 77.8 84.7 100.8 107.3
S&P 500 100.0 105.5 66.5 84.1 96.7 98.8
(dollars in millions, except per share amounts)
2011 2010 2009 2008 2007
Results of Operations
Operating revenues $ 110,875 $ 106,565 $ 107,808 $ 97,354 $ 93,469
Operating income 12,880 14,645 15,978 2,612 17,816
Income (loss) before discontinued operations and
extraordinary item attributable to Verizon 2,404 2,549 4,894 (2,193) 7,201
Per common share – basic .85 .90 1.72 (.77) 2.48
Per common share – diluted .85 .90 1.72 (.77) 2.48
Net income (loss) attributable to Verizon 2,404 2,549 4,894 (2,193) 7,212
Per common share – basic .85 .90 1.72 (.77) 2.49
Per common share – diluted .85 .90 1.72 (.77) 2.49
Cash dividends declared per common share 1.975 1.925 1.870 1.780 1.670
Net income attributable to noncontrolling interest 7,794 7,668 6,707 6,155 5,053
Financial Position
Total assets $ 230,461 $ 220,005 $ 226,907 $ 202,185 $ 186,942
Debt maturing within one year 4,849 7,542 7,205 4,993 2,954
Long-term debt 50,303 45,252 55,051 46,959 28,203
Employee benefit obligations 32,957 28,164 32,622 32,512 29,960
Noncontrolling interest 49,938 48,343 42,761 37,199 32,266
Equity attributable to Verizon 35,970 38,569 41,382 41,592 50,580
• Significanteventsaffectingourhistoricalearningstrendsin2009through2011aredescribedin“OtherItems”inthe“Management’sDiscussionandAnalysisofFinancialConditionandResults
ofOperations”section.
• 2008and2007dataincludessalesofbusinesses,severance,pensionandbenefitcharges,mergerintegrationcosts,andotheritems.