Verizon Wireless 2011 Annual Report Download - page 79
Download and view the complete annual report
Please find page 79 of the 2011 Verizon Wireless annual report below. You can navigate through the pages in the report by either clicking on the pages listed below, or by using the keyword search tool below to find specific information within the annual report.-
 1
1 -
2
-
3
-
4
-
5
-
6
-
7
-
8
-
9
-
10
-
11
-
12
-
13
-
14
-
15
-
16
-
17
-
18
-
19
-
20
-
21
-
22
-
23
-
24
-
25
-
26
-
27
-
28
-
29
-
30
-
31
-
32
-
33
-
34
-
35
-
36
-
37
-
38
-
39
-
40
-
41
-
42
-
43
-
44
-
45
-
46
-
47
-
48
-
49
-
50
-
51
-
52
-
53
-
54
-
55
-
56
-
57
-
58
-
59
-
60
-
61
-
62
-
63
-
64
-
65
-
66
-
67
-
68
-
 69
69 -
 70
70 -
 71
71 -
 72
72 -
 73
73 -
 74
74 -
 75
75 -
 76
76 -
 77
77 -
 78
78 -
 79
79 -
 80
80 -
 81
81 -
 82
82 -
 83
83 -
 84
84 -
 85
85 -
 86
86 -
 87
87 -
 88
88
 |
 |

nOtEs tO cOnsOlidatEd Financial statEMEnts continued
77
NOTE 13
SEGMENT INFORMATION
Reportable Segments
We have two reportable segments, which we operate and manage as
strategic business units and organize by products and services. We mea-
sure and evaluate our reportable segments based on segment operating
income, consistent with the chief operating decision maker’s assessment
of segment performance.
Corporate, eliminations and other includes unallocated corporate
expenses, intersegment eliminations recorded in consolidation, the
results of other businesses, such as our investments in unconsolidated
businesses, pension and other employee benefit related costs, lease
financing, as well as the historical results of divested operations and other
adjustments and gains and losses that are not allocated in assessing seg-
ment performance due to their non-operational nature. Although such
transactions are excluded from the business segment results, they are
included in reported consolidated earnings. Gains and losses that are not
individually significant are included in all segment results as these items
are included in the chief operating decision maker’s assessment of seg-
ment performance.
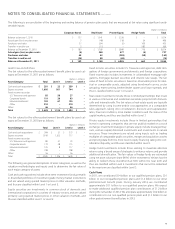
The reconciliation of segment operating revenues and expenses to con-
solidated operating revenues and expenses below also includes those
items of a non-recurring or non-operational nature. We exclude from
segment results the effects of certain items that management does not
consider in assessing segment performance, primarily because of their
non-recurring or non-operational nature.
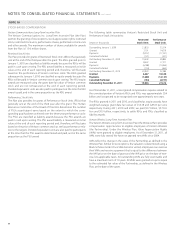
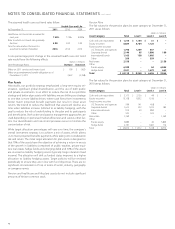
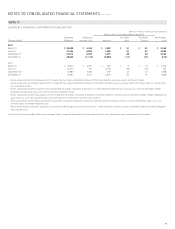
The following table provides operating financial information for our two reportable segments:
(dollars in millions)
2011 Verizon Wireless Wireline Total Segments
External Operating Revenues
Retail service $ 56,601 $ – $ 56,601
Other service 2,497 – 2,497
Service revenue 59,098 – 59,098
Equipment 7,446 – 7,446
Other 3,517 – 3,517
Consumer retail – 13,605 13,605
Small business – 2,720 2,720
Mass Markets – 16,325 16,325
Strategic services – 7,607 7,607
Other – 8,014 8,014
Global Enterprise – 15,621 15,621
Global Wholesale – 6,795 6,795
Other – 704 704
Intersegment revenues 93 1,237 1,330
Total operating revenues 70,154 40,682 110,836
Cost of services and sales 24,086 22,158 46,244
Selling, general and administrative expense 19,579 9,107 28,686
Depreciation and amortization expense 7,962 8,458 16,420
Total operating expenses 51,627 39,723 91,350
Operating income $ 18,527 $ 959 $ 19,486
Assets $ 147,378 $ 86,185 $ 233,563
Plant, property and equipment, net 33,451 54,149 87,600
Capital expenditures 8,973 6,399 15,372
In order to comply with regulatory conditions related to the acquisition
of Alltel in January 2009, Verizon Wireless divested overlapping proper-
ties in 105 operating markets in 24 states during the first half of 2010. In
addition, on July 1, 2010, certain of Verizon’s local exchange business and
related activities in 14 states were spun off (see Note 2). Accordingly, the
historical Verizon Wireless and Wireline results for these operations have
been reclassified to Corporate and Other to reflect comparable segment
operating results.
We have adjusted prior-period consolidated and segment information,
where applicable, to conform to current year presentation.
Our segments and their principal activities consist of the following:
Segment Description
Verizon Wireless
Verizon Wireless’ communications products and services
include wireless voice and data services and equipment sales,
which are provided to consumer, business and government
customers across the United States.
Wireline
Wireline’s communications products and services include
voice, Internet access, broadband video and data, Internet
protocol network services, network access, long distance
and other services. We provide these products and services
to consumers in the United States, as well as to carriers,
businesses and government customers both in the United
States and in over 150 other countries around the world.