Verizon Wireless 2011 Annual Report Download - page 77
Download and view the complete annual report
Please find page 77 of the 2011 Verizon Wireless annual report below. You can navigate through the pages in the report by either clicking on the pages listed below, or by using the keyword search tool below to find specific information within the annual report.-
 1
1 -
2
-
3
-
4
-
5
-
6
-
7
-
8
-
9
-
10
-
11
-
12
-
13
-
14
-
15
-
16
-
17
-
18
-
19
-
20
-
21
-
22
-
23
-
24
-
25
-
26
-
27
-
28
-
29
-
30
-
31
-
32
-
33
-
34
-
35
-
36
-
37
-
38
-
39
-
40
-
41
-
42
-
43
-
44
-
45
-
46
-
47
-
48
-
49
-
50
-
51
-
52
-
53
-
54
-
55
-
56
-
57
-
58
-
59
-
60
-
61
-
62
-
63
-
64
-
65
-
66
-
 67
67 -
 68
68 -
 69
69 -
 70
70 -
 71
71 -
 72
72 -
 73
73 -
 74
74 -
 75
75 -
 76
76 -
 77
77 -
 78
78 -
 79
79 -
 80
80 -
 81
81 -
 82
82 -
 83
83 -
 84
84 -
 85
85 -
 86
86 -
 87
87 -
88
 |
 |

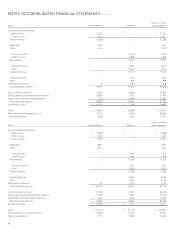
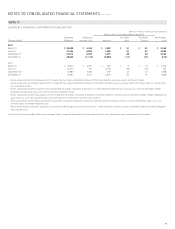
nOtEs tO cOnsOlidatEd Financial statEMEnts continued
75
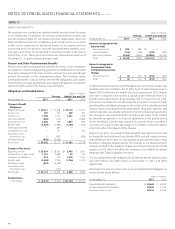
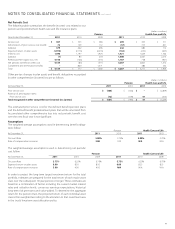
NOTE 12
TAXES
The components of income before provision for income taxes are
as follows:
(dollars in millions)
Years Ended December 31, 2011 2010 2009
Domestic $ 9,724 $ 11,921 $ 12,625
Foreign 759 763 895
Total $ 10,483 $ 12,684 $ 13,520
The components of the provision for income taxes are as follows:
(dollars in millions)
Years Ended December 31, 2011 2010 2009
Current
Federal $ 193 $ (705) $ (611)
Foreign 25 (19) 73
State and Local 290 (42) 364
Total 508 (766) (174)
Deferred
Federal 276 2,945 1,616
Foreign (38) (24) (35)
State and Local (455) 316 518
Total (217) 3,237 2,099
Investment tax credits (6) (4) (6)
Total income tax provision $ 285 $ 2,467 $ 1,919
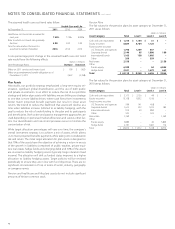
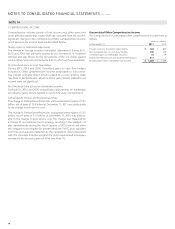
The following table shows the principal reasons for the difference
between the effective income tax rate and the statutory federal income
tax rate:
Years Ended December 31, 2011 2010 2009
Statutory federal income tax rate 35.0% 35.0% 35.0%
State and local income tax rate,
net of federal tax benefits (1.0) 1.4 1.5
Affordable housing credit (1.8) (1.3) (1.0)
Employee benefits including
ESOP dividend (1.4) (1.2) (1.6)
Medicare Part D subsidy charge –6.9 –
Equity in earnings from
unconsolidated businesses (1.9) (1.6) (1.6)
Noncontrolling interest (23.0) (19.5) (16.0)
Other, net (3.2) (0.3) (2.1)
Effective income tax rate 2.7% 19.4% 14.2%
The effective income tax rate in 2011 decreased to 2.7% from 19.4% in
2010. This decrease was primarily driven by lower income before provi-
sion for income taxes as a result of higher pension and benefit charges
recorded in 2011 as well as tax benefits from state valuation allowance
reversals in 2011. The decrease was also due to a one-time, non-cash
income tax charge of $1.0 billion recorded during the three months ended
March 31, 2010 as a result of the enactment of the Patient Protection and
Affordable Care Act and the Health Care and Education Reconciliation
Act of 2010, both of which became law in March 2010 (collectively the
Health Care Act). Under the Health Care Act, beginning in 2013, Verizon
and other companies that receive a subsidy under Medicare Part D to
provide retiree prescription drug coverage will no longer receive a fed-
eral income tax deduction for the expenses incurred in connection with
providing the subsidized coverage to the extent of the subsidy received.
Because future anticipated retiree prescription drug plan liabilities and
related subsidies are already reflected in Verizon’s financial statements,
this change in law required Verizon to reduce the value of the related tax
benefits recognized in its financial statements in the period during which
the Health Care Act was enacted.
The effective income tax rate in 2010 increased to 19.4% from 14.2% in
2009. The increase was primarily driven by a one-time, non-cash income
tax charge of $1.0 billion for the Health Care Act described above. The
increase was partially offset primarily by higher earnings attributable to
Vodafone’s noncontrolling interest in the Verizon Wireless partnership.
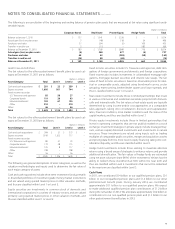
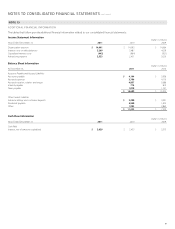
The amounts of cash taxes paid are as follows:
(dollars in millions)
Years Ended December 31, 2011 2010 2009
Income taxes, net of amounts refunded $ 762 $ 430 $ 158
Employment taxes 1,231 1,296 1,349
Property and other taxes 1,883 1,963 2,065
Total $ 3,876 $ 3,689 $ 3,572