Verizon Wireless 2011 Annual Report Download - page 26
Download and view the complete annual report
Please find page 26 of the 2011 Verizon Wireless annual report below. You can navigate through the pages in the report by either clicking on the pages listed below, or by using the keyword search tool below to find specific information within the annual report.-
 1
1 -
2
-
3
-
4
-
5
-
6
-
7
-
8
-
9
-
10
-
11
-
12
-
13
-
14
-
15
-
 16
16 -
 17
17 -
 18
18 -
 19
19 -
 20
20 -
 21
21 -
 22
22 -
 23
23 -
 24
24 -
 25
25 -
 26
26 -
 27
27 -
 28
28 -
 29
29 -
 30
30 -
 31
31 -
 32
32 -
 33
33 -
 34
34 -
 35
35 -
 36
36 -
37
-
38
-
39
-
40
-
41
-
42
-
43
-
44
-
45
-
46
-
47
-
48
-
49
-
50
-
51
-
52
-
53
-
54
-
55
-
56
-
57
-
58
-
59
-
60
-
61
-
62
-
63
-
64
-
65
-
66
-
67
-
68
-
69
-
70
-
71
-
72
-
73
-
74
-
75
-
76
-
77
-
78
-
79
-
80
-
81
-
82
-
83
-
84
-
85
-
86
-
87
-
88
 |
 |

24
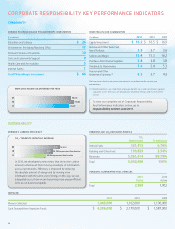
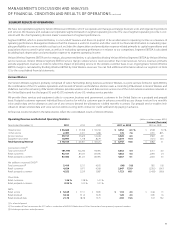
cORPORatE REsPOnsiBilitY KEY PERFORMancE indicatORs
COMMUNITY
VERIZON FOUNDATION PHILANTHROPIC INVESTMENTS
($ in millions)
Education and Literacy $ 26
Volunteerism (Including Matching Gifts) 17
Domestic Violence Prevention 10
Civic and Community Support 9
Health Care and Accessibility 3
Internet Safety 1
Total Philanthropic Investment $ 66
INVESTING IN OUR COMMUNITIES
($ in billions) 2011 2010 2009
Capital Investment $ 16.2 $ 16.5 $ 16.9
Income and Other Taxes Paid,
Net of Refunds 3.9 3.7 3.6
Salaries and Wages 15.4 15.3 16.2
Purchases from Diverse Suppliers 3.8 3.8 3.8
Dividends to Shareowners 5.6 5.4 5.3
Pension and Other
Retirement Payments(1) 4.3 3.7 4.3
We have reclassified certain prior year amounts to conform to the current year
presentation.
(1) Benefit payments are made from employee benefit trusts and not Verizon’s general
corporate assets. The trusts are periodically funded by Verizon and by investment
returns.
702,618
733,806
674,207
10
09
11
EMPLOYEE HOURS VOLUNTEERED PER YEAR
To view our complete set of Corporate Responsibility
Key Performance Indicators online, go to
responsibility.verizon.com/2011.
SUSTAINABILITY
VERIZON’S CARBON EFFICIENCY VERIZON’S CO EMISSIONS PROFILE
CO2
(metric tons)
% emissions
Vehicle Fuels 381,413 6.76%
Building and Other Fuels 199,859 3.54%
Electricity 5,061,414 89.79%
Total 5,642,686 100%
VERIZON’S ALTERNATIVEFUEL VEHICLES
2011
Active
2010
Active
Total 2,569 1,902
HOPELINE
2011 2010 2009
Phones Collected 1,043,000 1,102,000 1,100,000
Cash Donated from HopeLine Funds $4,206,000 $2,179,000 $1,587,000
30.4% improvement from baseline
15.75% improvement from baseline
baseline
0.092
0.077
0.064
10
09
11
CO2 / TERABYTE (MONTHLY AVERAGE)
In 2010, we developed a new metric that shows the carbon
emissions that result from moving a terabyte of information
across our networks. Eciency is improved by reducing
the absolute amount of energy and by moving more
information with the same unit of energy. In this way, we can
adequately assess how we are becoming more energy ecient,
even as our business expands.