Verizon Wireless 2011 Annual Report Download - page 38
Download and view the complete annual report
Please find page 38 of the 2011 Verizon Wireless annual report below. You can navigate through the pages in the report by either clicking on the pages listed below, or by using the keyword search tool below to find specific information within the annual report.-
 1
1 -
2
-
3
-
4
-
5
-
6
-
7
-
8
-
9
-
10
-
11
-
12
-
13
-
14
-
15
-
16
-
17
-
18
-
19
-
20
-
21
-
22
-
23
-
24
-
25
-
26
-
27
-
 28
28 -
 29
29 -
 30
30 -
 31
31 -
 32
32 -
 33
33 -
 34
34 -
 35
35 -
 36
36 -
 37
37 -
 38
38 -
 39
39 -
 40
40 -
 41
41 -
 42
42 -
 43
43 -
 44
44 -
 45
45 -
 46
46 -
 47
47 -
 48
48 -
49
-
50
-
51
-
52
-
53
-
54
-
55
-
56
-
57
-
58
-
59
-
60
-
61
-
62
-
63
-
64
-
65
-
66
-
67
-
68
-
69
-
70
-
71
-
72
-
73
-
74
-
75
-
76
-
77
-
78
-
79
-
80
-
81
-
82
-
83
-
84
-
85
-
86
-
87
-
88
 |
 |

36
Wireline
The Wireline segment provides customers with voice service including long distance, broadband video and data, IP network services, network access
and other services. We provide these products and services to consumers and small businesses in the United States, as well as to businesses and
government customers and carriers both in the United States and in over 150 other countries around the world.
Reclassificationshavebeenmadetoreflectcomparableoperatingresultsforthespin-offoftheoperationsincludedintheFrontiertransaction,which
weownedthroughJune30,2010(see“AcquisitionsandDivestitures”).
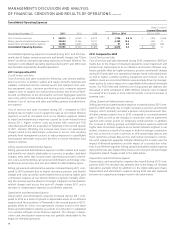
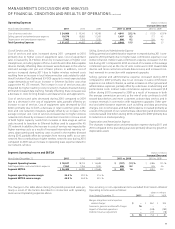
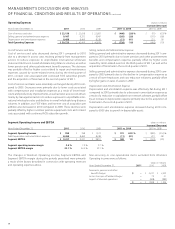
Operating Revenues and Selected Operating Statistics (dollars in millions)
Increase/(Decrease)
Years Ended December 31, 2011 2010 2009 2011 vs. 2010 2010 vs. 2009
Consumer retail $ 13,606 $ 13,419 $ 13,202 $ 187 1.4 % $ 217 1.6 %
Small business 2,731 2,837 2,913 (106) (3.7) (76) (2.6)
MassMarkets 16,337 16,256 16,115 81 0.5 141 0.9
Strategic services 7,607 6,602 6,195 1,005 15.2 407 6.6
Other 8,015 8,714 9,094 (699) (8.0) (380) (4.2)
Global Enterprise 15,622 15,316 15,289 306 2.0 27 0.2
Global Wholesale 7,973 8,746 9,533 (773) (8.8) (787) (8.3)
Other 750 909 1,514 (159) (17.5) (605) (40.0)
Total Operating Revenues $ 40,682 $ 41,227 $ 42,451 $ (545) (1.3) $ (1,224) (2.9)
Connections (’000):(1)
Total voice connections 24,137 26,001 28,323 (1,864) (7.2) (2,322) (8.2)
Total Broadband connections 8,670 8,392 8,160 278 3.3 232 2.8
FiOSInternetsubscribers 4,817 4,082 3,286 735 18.0 796 24.2
FiOSVideosubscribers 4,173 3,472 2,750 701 20.2 722 26.3
(1) As of end of period.
Wireline’srevenuesdecreasedduring2011comparedto2010primarily
driven by declines in Global Wholesale and Other Global Enterprise reve-
nues, largely as a result of declines in voice connections and in traditional
voice and data services provided to business customers, partially offset
by increased revenues from our growth markets as well as the impact of
the revenues of Terremark.
Mass Markets
MassMarketsoperationsprovidelocalexchange(basicserviceandend-
user access) and long distance (including regional toll) voice services,
broadbandservices(includinghigh-speedInternet,FiOSInternetand
FiOSVideo)toresidentialandsmallbusinesssubscribers.
2011 Compared to 2010
MassMarketsrevenuesincreasedslightlyduring2011comparedto2010
primarilyduetotheexpansionofconsumerandsmallbusinessFiOSser-
vices (Voice, Internet, Video), partially offset by the continued decline of
local exchange revenues.
AswecontinuetoexpandthenumberofpremiseseligibletoorderFiOS
servicesandextendoursalesandmarketingeffortstoattractnewFiOS
subscribers, we have continued to grow our subscriber base and con-
sistentlyimprovedpenetrationrateswithinourFiOSserviceareas.Our
pricing strategy allows us to provide competitive offerings to our cus-
tomers and potential customers. As of December 31, 2011, we achieved
penetrationratesof35.5%and31.5%forFiOSInternetandFiOSVideo,
respectively,comparedtopenetrationratesof31.9%and28.0%forFiOS
InternetandFiOSVideo,respectively,atDecember31,2010.
MassMarketsrevenueswerenegativelyimpactedbythedeclineoflocal
exchange revenues primarily due to a 7.2% decline in total voice connec-
tions resulting primarily from competition and technology substitution.
Total voice connections include traditional switched access lines in ser-
viceaswellasFiOSdigitalvoiceconnections.Themajorityofthedecline
in total voice connections was sustained in the residential retail market,
which experienced a 7.3% voice connection loss primarily due to sub-
stituting traditional landline services with wireless, VoIP, broadband and
cable services. There was also a 5.3% decline in small business retail voice
connections, primarily reflecting challenging economic conditions, com-
petition and a shift to both IP and high-speed circuits.
2010 Compared to 2009
TheincreaseinMassMarketsrevenueduring2010comparedto2009
was primarily driven by the expansion of consumer and small business
FiOSservices(Voice,InternetandVideo),whicharetypicallysoldinbun-
dles, partially offset by the decline of local exchange revenues principally
as a result of a decline in switched access lines as of December 31, 2010
compared to December 31, 2009, primarily as a result of competition and
technology substitution. The majority of the decrease was sustained in
the residential retail market, which experienced a 9.0% access line loss
primarily due to substituting traditional landline services with wireless,
VoIP, broadband and cable services. Also contributing to the decrease
was a decline of nearly 5.0% in small business retail access lines, primarily
reflecting economic conditions, competition and a shift to both IP and
high-speed circuits.
As of December 31, 2010, we achieved penetration rates of 31.9% and
28.0%forFiOSInternetandFiOSVideo,respectively,comparedtopen-
etration rates of 28.3% and 24.7% for FiOS Internet and FiOS Video,
respectively, at December 31, 2009.
ManagEMEnt’s discussiOn and analYsis
OF Financial cOnditiOn and REsults OF OPERatiOns continued