Verizon Wireless 2011 Annual Report Download - page 75
Download and view the complete annual report
Please find page 75 of the 2011 Verizon Wireless annual report below. You can navigate through the pages in the report by either clicking on the pages listed below, or by using the keyword search tool below to find specific information within the annual report.-
 1
1 -
2
-
3
-
4
-
5
-
6
-
7
-
8
-
9
-
10
-
11
-
12
-
13
-
14
-
15
-
16
-
17
-
18
-
19
-
20
-
21
-
22
-
23
-
24
-
25
-
26
-
27
-
28
-
29
-
30
-
31
-
32
-
33
-
34
-
35
-
36
-
37
-
38
-
39
-
40
-
41
-
42
-
43
-
44
-
45
-
46
-
47
-
48
-
49
-
50
-
51
-
52
-
53
-
54
-
55
-
56
-
57
-
58
-
59
-
60
-
61
-
62
-
63
-
64
-
 65
65 -
 66
66 -
 67
67 -
 68
68 -
 69
69 -
 70
70 -
 71
71 -
 72
72 -
 73
73 -
 74
74 -
 75
75 -
 76
76 -
 77
77 -
 78
78 -
 79
79 -
 80
80 -
 81
81 -
 82
82 -
 83
83 -
 84
84 -
 85
85 -
86
-
87
-
88
 |
 |

nOtEs tO cOnsOlidatEd Financial statEMEnts continued
73
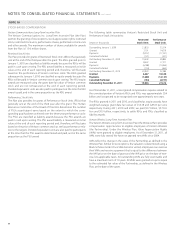
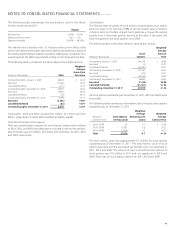
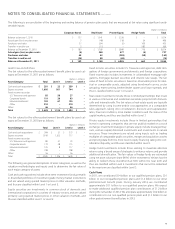
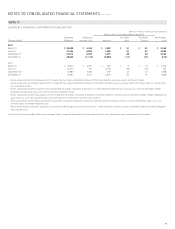
The following is a reconciliation of the beginning and ending balance of pension plan assets that are measured at fair value using significant unob-
servable inputs:
(dollars in millions)
Corporate Bonds Real Estate Private Equity Hedge Funds Total
Balance at January 1, 2010 $ 137 $ 1,541 $ 5,336 $ – $ 7,014
Actual gain (loss) on plan assets 3 (49) 518 24 496
Purchases and sales 37 294 (5) 109 435
Transfers in and/or out 3 (17) – 583 569
Balance at December 31, 2010 $ 180 $ 1,769 $ 5,849 $ 716 $ 8,514
Actual gain (loss) on plan assets (4) 258 477 (4) 727
Purchases and sales 48 43 (203) (50) (162)
Transfers in and/or out (35) 88 (68) – (15)
Balance at December 31, 2011 $ 189 $ 2,158 $ 6,055 $ 662 $ 9,064
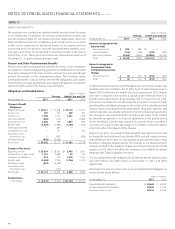
Fixed income securities include U.S. Treasuries and agencies, debt obli-
gations of foreign governments and domestic and foreign corporations.
Fixed income also includes investments in collateralized mortgage obli-
gations, mortgage backed securities and interest rate swaps. The fair
value of fixed income securities is based on observable prices for iden-
tical or comparable assets, adjusted using benchmark curves, sector
grouping, matrix pricing, broker/dealer quotes and issuer spreads, and
thus is classified within Level 1 or Level 2.
Real estate investments include those in limited partnerships that invest
in various commercial and residential real estate projects both domesti-
cally and internationally. The fair values of real estate assets are typically
determined by using income and/or cost approaches or a comparable
sales approach, taking into consideration discount and capitalization
rates, financial conditions, local market conditions and the status of the
capital markets, and thus are classified within Level 3.
Private equity investments include those in limited partnerships that
invest in operating companies that are not publicly traded on a stock
exchange. Investment strategies in private equity include leveraged buy-
outs, venture capital, distressed investments and investments in natural
resources. These investments are valued using inputs such as trading
multiples of comparable public securities, merger and acquisition activity
and pricing data from the most recent equity financing taking into con-
sideration illiquidity, and thus are classified within Level 3.
Hedge fund investments include those seeking to maximize absolute
returns using a broad range of strategies to enhance returns and provide
additional diversification. The fair values of hedge funds are estimated
using net asset value per share (NAV) of the investments. Verizon has the
ability to redeem these investments at NAV within the near term and
thus are classified within Level 2. Investments that cannot be redeemed
in the near term are classified within Level 3.
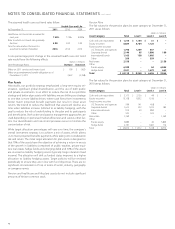
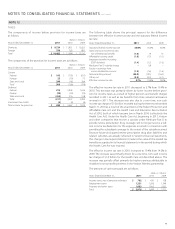
Cash Flows
In 2011, we contributed $0.4 billion to our qualified pension plans, $0.1
billion to our nonqualified pension plans and $1.4 billion to our other
postretirement benefit plans. During January 2012, we contributed
approximately $0.1 billion to our qualified pension plans. We expect
to make additional qualified pension plan contributions of $1.2 billion
during the remainder of 2012. We anticipate approximately $0.2 billion in
contributions to our non-qualified pension plans and $1.5 billion to our
other postretirement benefit plans in 2012.
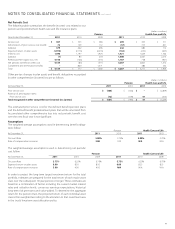
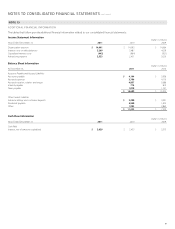
Health Care and Life Plans
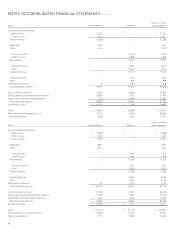
The fair values for the other postretirement benefit plans by asset cat-
egory at December 31, 2011 are as follows:
(dollars in millions)
Asset Category Total Level 1 Level 2 Level 3
Cash and cash equivalents $ 281 $ 22 $ 259 $ –
Equity securities 1,695 951 744 –
Fixed income securities
U.S. Treasuries and agencies 85 58 27 –
Corporate bonds 119 26 93 –
International bonds 192 67 125 –
Other 210 – 210 –
Other 46 – 46 –
Total $ 2,628 $ 1,124 $ 1,504 $ –
The fair values for the other postretirement benefit plans by asset cat-
egory at December 31, 2010 are as follows:
(dollars in millions)
Asset Category Total Level 1 Level 2 Level 3
Cash and cash equivalents $ 394 $ 21 $ 373 $ –
Equity securities 1,919 1,202 717 –
Fixed income securities
U.S. Treasuries and agencies 80 47 33 –
Corporate bonds 173 58 115 –
International bonds 125 8 117 –
Other 198 – 198 –
Other 56 – 56 –
Total $ 2,945 $ 1,336 $ 1,609 $ –
The following are general descriptions of asset categories, as well as the
valuation methodologies and inputs used to determine the fair value of
each major category of assets.
Cash and cash equivalents include short-term investment funds, primarily
in diversified portfolios of investment grade money market instruments
and are valued using quoted market prices or other valuation methods,
and thus are classified within Level 1 or Level 2.
Equity securities are investments in common stock of domestic and
international corporations in a variety of industry sectors, and are valued
primarily using quoted market prices or other valuation methods, and
thus are classified within Level 1 or Level 2.