Verizon Wireless 2011 Annual Report Download - page 31
Download and view the complete annual report
Please find page 31 of the 2011 Verizon Wireless annual report below. You can navigate through the pages in the report by either clicking on the pages listed below, or by using the keyword search tool below to find specific information within the annual report.-
 1
1 -
2
-
3
-
4
-
5
-
6
-
7
-
8
-
9
-
10
-
11
-
12
-
13
-
14
-
15
-
16
-
17
-
18
-
19
-
20
-
 21
21 -
 22
22 -
 23
23 -
 24
24 -
 25
25 -
 26
26 -
 27
27 -
 28
28 -
 29
29 -
 30
30 -
 31
31 -
 32
32 -
 33
33 -
 34
34 -
 35
35 -
 36
36 -
 37
37 -
 38
38 -
 39
39 -
 40
40 -
 41
41 -
42
-
43
-
44
-
45
-
46
-
47
-
48
-
49
-
50
-
51
-
52
-
53
-
54
-
55
-
56
-
57
-
58
-
59
-
60
-
61
-
62
-
63
-
64
-
65
-
66
-
67
-
68
-
69
-
70
-
71
-
72
-
73
-
74
-
75
-
76
-
77
-
78
-
79
-
80
-
81
-
82
-
83
-
84
-
85
-
86
-
87
-
88
 |
 |

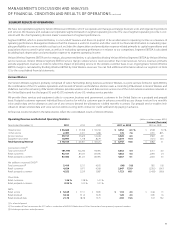
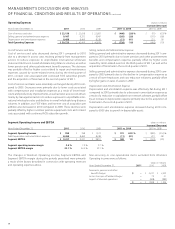
Consolidated Revenues
(dollars in millions)
Increase/(Decrease)
Years Ended December 31, 2011 2010 2009 2011 vs. 2010 2010 vs. 2009
Verizon Wireless
Service revenue $ 59,157 $ 55,629 $ 52,046 $ 3,528 6.3 % $ 3,583 6.9 %
Equipment and other 10,997 7,778 8,279 3,219 41.4 (501) (6.1)
Total 70,154 63,407 60,325 6,747 10.6 3,082 5.1
Wireline
MassMarkets 16,337 16,256 16,115 81 0.5 141 0.9
Global Enterprise 15,622 15,316 15,289 306 2.0 27 0.2
Global Wholesale 7,973 8,746 9,533 (773) (8.8) (787) (8.3)
Other 750 909 1,514 (159) (17.5) (605) (40.0)
Total 40,682 41,227 42,451 (545) (1.3) (1,224) (2.9)
Corporate, eliminations and other 39 1,931 5,032 (1,892) (98.0) (3,101) (61.6)
Consolidated Revenues $ 110,875 $ 106,565 $ 107,808 $ 4,310 4.0 $ (1,243) (1.2)
oftherevenuesofTerremark,andinMassMarkets,primarilyduetothe
expansionofFiOSservices(Voice,InternetandVideo),partiallyoffsetby
the decline of local exchange revenues.
2010 Compared to 2009
The decrease in Consolidated revenues during 2010 compared to 2009
was primarily due to the impact of divested operations and declines in
revenues at our Wireline segment resulting from switched access line
lossesanddecreasedMOUsintraditionalvoiceproducts,partiallyoffset
by higher revenues in our growth markets.
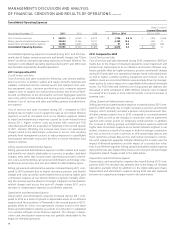
TheincreaseinVerizonWireless’ revenuesduring2010 compared to
2009 was primarily due to growth in service revenue. Service revenue
increased during 2010 compared to 2009 primarily due to an increase in
total customers since January 1, 2010, as well as continued growth in our
dataARPU,partiallyoffsetbyadeclineinvoiceARPU.
Total wireless data revenue was $19.6 billion and accounted for 35.1% of
service revenue during 2010, compared to $15.6 billion and 29.9% during
2009. Total data revenue increased as a result of the increased penetra-
tion of data offerings, in particular for web and e-mail services resulting in
part from increased sales of smartphone and other data-capable devices.
Voice revenue decreased as a result of continued declines in our voice
ARPU,partiallyoffsetbyanincreaseinthenumberofcustomers.
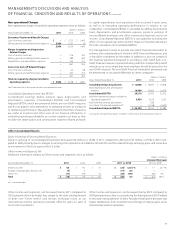
Equipment and other revenue decreased during 2010 compared to 2009
due to a decrease in the number of equipment units sold, which resulted
from a decrease in customer gross additions.
ThedecreaseinWireline’srevenuesduring2010comparedto2009was
primarily due to lower Global Wholesale and Other revenue, partially
offsetbyanincreaseinMassMarketsrevenue.ThedecreaseinGlobal
Wholesale revenues during 2010 compared to 2009 was primarily due to
decreasedMOUsintraditionalvoiceproducts,increasesinvoicetermina-
tion pricing on certain international routes, which negatively impacted
volume, and continued rate compression due to competition in the
marketplace. The decrease in Other revenue during 2010 compared to
2009 was primarily due to reduced business volumes, including former
MCImassmarketcustomerlosses.TheincreaseinMassMarketsrevenue
during 2010 compared to 2009 was primarily driven by the expansion of
FiOSservices(Voice,InternetandVideo),partiallyoffsetbythedeclineof
local exchange revenues principally as a result of a decline in switched
access lines. Global Enterprise revenues during 2010 compared to 2009
were essentially unchanged as higher customer premise equipment and
strategic networking revenues were offset by lower local services and tra-
ditional circuit-based revenues.
29
ManagEMEnt’s discussiOn and analYsis
OF Financial cOnditiOn and REsults OF OPERatiOns continued
2011 Compared to 2010
The increase in consolidated revenues during 2011 compared to 2010
was primarily due to higher revenues at Verizon Wireless, the expan-
sionofFiOSservicesandincreasedrevenuesfromstrategicservicesat
our Wireline segment. In addition, the increase during 2011 was partially
offset by the impact of divested operations.
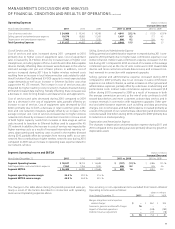
TheincreaseinVerizonWireless’revenuesduring2011comparedto2010
was primarily due to growth in both service and equipment revenue.
Service revenue increased during 2011 compared to 2010 primarily
due to an increase in total connections since January 1, 2011, as well
as continued growth in our data revenue, partially offset by a decline in
voice revenue.
Total wireless data revenue was $23.6 billion and accounted for 40.0% of
service revenue during 2011 compared to $19.6 billion and 35.1% during
2010. Total data revenue continues to increase as a result of the increased
penetration of data offerings, in particular for smartphone data service
plans which provide our customers with access to web and e-mail via
their wireless device. We have also experienced growth in data revenues
for internet data devices such as tablets, USB modems and Jetpacks
which also require service plans allowing access to data services. Voice
revenue decreased as a result of continued declines in retail postpaid
voiceARPUduetotheongoingimpactofourretailcustomersseeking
to optimize the value of our voice minute bundles, partially offset by an
increase in the number of customers.
Equipment and other revenue increased during 2011 compared to 2010
due to an increase in the sales volume for smartphones to new and
upgrading customers. Partially offsetting these increases was a decrease
in the sales volume for basic phones in both periods.
The decrease inWireline’s revenues during 2011 compared to 2010
was primarily driven by declines in Global Wholesale and Other Global
Enterprise revenues. The decrease in Global Wholesale revenues was pri-
marily due to a $0.4 billion decline in international voice revenues as a
resultofdecreasedminutesofuse(MOUs)intraditionalvoiceproducts
as a result of increases in voice termination pricing on certain interna-
tional routes. Other Global Enterprise revenues declined primarily due
to lower customer premise equipment revenues, reflecting our focus
on improving margins by de-emphasizing sales of equipment that are
not a part of an overall enterprise solutions bundle, as well as customers
migrating to next generation IP services. Other Wireline revenue also
decreasedprimarily as a resultofformerMCI mass marketcustomer
losses. These revenue declines were partially offset by continued revenue
growth in Global Enterprise strategic services, in part due to the inclusion