Verizon Wireless 2011 Annual Report Download - page 73
Download and view the complete annual report
Please find page 73 of the 2011 Verizon Wireless annual report below. You can navigate through the pages in the report by either clicking on the pages listed below, or by using the keyword search tool below to find specific information within the annual report.-
 1
1 -
2
-
3
-
4
-
5
-
6
-
7
-
8
-
9
-
10
-
11
-
12
-
13
-
14
-
15
-
16
-
17
-
18
-
19
-
20
-
21
-
22
-
23
-
24
-
25
-
26
-
27
-
28
-
29
-
30
-
31
-
32
-
33
-
34
-
35
-
36
-
37
-
38
-
39
-
40
-
41
-
42
-
43
-
44
-
45
-
46
-
47
-
48
-
49
-
50
-
51
-
52
-
53
-
54
-
55
-
56
-
57
-
58
-
59
-
60
-
61
-
62
-
 63
63 -
 64
64 -
 65
65 -
 66
66 -
 67
67 -
 68
68 -
 69
69 -
 70
70 -
 71
71 -
 72
72 -
 73
73 -
 74
74 -
 75
75 -
 76
76 -
 77
77 -
 78
78 -
 79
79 -
 80
80 -
 81
81 -
 82
82 -
 83
83 -
84
-
85
-
86
-
87
-
88
 |
 |

nOtEs tO cOnsOlidatEd Financial statEMEnts continued
71
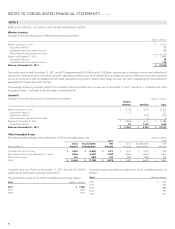
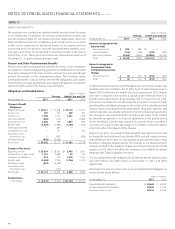
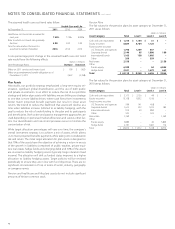
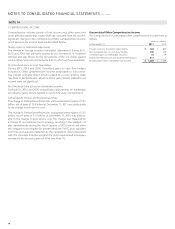
Net Periodic Cost
The following table summarizes the benefit (income) cost related to our
pension and postretirement health care and life insurance plans:
(dollars in millions)
Pension Health Care and Life
Years Ended December 31, 2011 2010 2009 2011 2010 2009
Service cost $ 307 $ 353 $ 384 $ 299 $ 305 $ 311
Amortization of prior service cost (credit) 72 109 112 (57) 375 401
Subtotal 379 462 496 242 680 712
Expected return on plan assets (1,976) (2,176) (2,216) (163) (252) (205)
Interest cost 1,590 1,797 1,924 1,421 1,639 1,766
Subtotal (7) 83 204 1,500 2,067 2,273
Remeasurement (gain) loss, net 4,146 (166) (515) 1,787 758 (901)
Net periodic benefit (income) cost 4,139 (83) (311) 3,287 2,825 1,372
Curtailment and termination benefits –860 1,371 –386 532
Total $ 4,139 $ 777 $ 1,060 $ 3,287 $ 3,211 $ 1,904
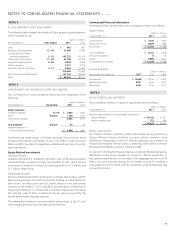
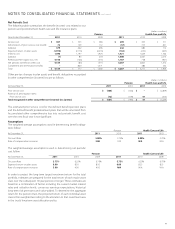
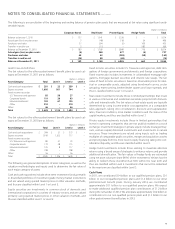
Other pre-tax changes in plan assets and benefit obligations recognized
in other comprehensive (income) loss are as follows:
(dollars in millions)
Pension Health Care and Life
At December 31, 2011 2010 2011 2010
Prior service cost $ (485) $ (336) $ – $ (2,859)
Reversal of amortization items
Prior service cost (72) (109) 57 (375)
Total recognized in other comprehensive (income) loss (pretax) $ (557) $ (445) $ 57 $ (3,234)
The estimated prior service cost for the defined benefit pension plans
and the defined benefit postretirement plans that will be amortized from
Accumulated other comprehensive loss into net periodic benefit cost
over the next fiscal year is not significant.
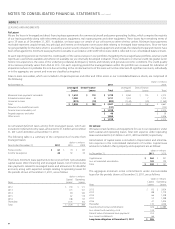
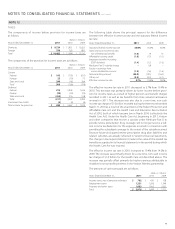
Assumptions
The weighted-average assumptions used in determining benefit obliga-
tions follow:
Pension Health Care and Life
At December 31, 2011 2010 2011 2010
Discount Rate 5.00 % 5.75 % 5.00 % 5.75 %
Rate of compensation increases 3.00 3.00 N/A N/A
The weighted-average assumptions used in determining net periodic
cost follow:
Pension Health Care and Life
At December 31, 2011 2010 2009 2011 2010 2009
Discount Rate 5.75 % 6.25 % 6.75 % 5.75 % 6.25 % 6.75 %
Expected return on plan assets 8.00 8.50 8.50 6.00 8.25 8.25
Rate of compensation increases 3.00 4.00 4.00 N/A N/A N/A
In order to project the long-term target investment return for the total
portfolio, estimates are prepared for the total return of each major asset
class over the subsequent 10-year period, or longer. Those estimates are
based on a combination of factors including the current market interest
rates and valuation levels, consensus earnings expectations, historical
long-term risk premiums and value-added. To determine the aggregate
return for the pension trust, the projected return of each individual asset
class is then weighted according to the allocation to that investment area
in the trust’s long-term asset allocation policy.