Verizon Wireless 2011 Annual Report Download - page 57
Download and view the complete annual report
Please find page 57 of the 2011 Verizon Wireless annual report below. You can navigate through the pages in the report by either clicking on the pages listed below, or by using the keyword search tool below to find specific information within the annual report.-
 1
1 -
2
-
3
-
4
-
5
-
6
-
7
-
8
-
9
-
10
-
11
-
12
-
13
-
14
-
15
-
16
-
17
-
18
-
19
-
20
-
21
-
22
-
23
-
24
-
25
-
26
-
27
-
28
-
29
-
30
-
31
-
32
-
33
-
34
-
35
-
36
-
37
-
38
-
39
-
40
-
41
-
42
-
43
-
44
-
45
-
46
-
 47
47 -
 48
48 -
 49
49 -
 50
50 -
 51
51 -
 52
52 -
 53
53 -
 54
54 -
 55
55 -
 56
56 -
 57
57 -
 58
58 -
 59
59 -
 60
60 -
 61
61 -
 62
62 -
 63
63 -
 64
64 -
 65
65 -
 66
66 -
 67
67 -
68
-
69
-
70
-
71
-
72
-
73
-
74
-
75
-
76
-
77
-
78
-
79
-
80
-
81
-
82
-
83
-
84
-
85
-
86
-
87
-
88
 |
 |

cOnsOlidatEd statEMEnts OF cHangEs in EquitY
55
(dollars in millions, except per share amounts, and shares in thousands)
Years Ended December 31, 2011 2010 2009
Shares Amount Shares Amount Shares Amount
Common Stock
Balance at beginning of year 2,967,610 $ 297 2,967,610 $ 297 2,967,610 $ 297
Balance at end of year 2,967,610 297 2,967,610 297 2,967,610 297
Contributed Capital
Balance at beginning of year 37,922 40,108 40,291
Access line spin-off –(2,184) –
Other (3) (2) (183)
Balance at end of year 37,919 37,922 40,108
Reinvested Earnings
Balance at beginning of year 4,368 7,260 7,676
Net income attributable to Verizon 2,404 2,549 4,894
Dividends declared ($1.975, $1.925, $1.87) per share (5,593) (5,441) (5,310)
Balance at end of year 1,179 4,368 7,260
Accumulated Other Comprehensive Income (Loss)
Balance at beginning of year attributable to Verizon 1,049 (1,372) (1,912)
Spin-off of local exchange businesses and related
landline activities (Note 2) –23 –
Adjusted balance at beginning of year 1,049 (1,349) (1,912)
Foreign currency translation adjustments (119) (171) 78
Unrealized gains on cash flow hedges 30 89 87
Unrealized gains (losses) on marketable securities (7) 29 87
Defined benefit pension and postretirement plans 316 2,451 288
Other comprehensive income 220 2,398 540
Balance at end of year attributable to Verizon 1,269 1,049 (1,372)
Treasury Stock
Balance at beginning of year (140,587) (5,267) (131,942) (5,000) (127,090) (4,839)
Other (Note 10) – – (9,000) (280) (5,000) (166)
Employee plans 6,982 265 347 13 142 5
Shareowner plans 11 – 8 – 6 –
Balance at end of year (133,594) (5,002) (140,587) (5,267) (131,942) (5,000)
Deferred Compensation-ESOPs and Other
Balance at beginning of year 200 89 79
Restricted stock equity grant 146 97 –
Amortization (38) 14 10
Balance at end of year 308 200 89
Noncontrolling Interest
Balance at beginning of year 48,343 42,761 37,199
Net income attributable to noncontrolling interest 7,794 7,668 6,707
Other comprehensive income (loss) 1(35) 103
Total comprehensive income 7,795 7,633 6,810
Distributions and other (6,200) (2,051) (1,248)
Balance at end of year 49,938 48,343 42,761
Total Equity $ 85,908 $ 86,912 $ 84,143
Comprehensive Income
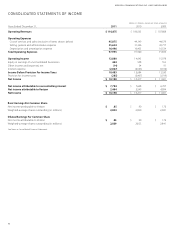
Net income $ 10,198 $ 10,217 $ 11,601
Other comprehensive income 221 2,363 643
Total Comprehensive Income $ 10,419 $ 12,580 $ 12,244
Comprehensive income attributable to noncontrolling interest $ 7,795 $ 7,633 $ 6,810
Comprehensive income attributable to Verizon 2,624 4,947 5,434
Total Comprehensive Income $ 10,419 $ 12,580 $ 12,244
See Notes to Consolidated Financial Statements
VERIZON COMMUNICATIONS INC. AND SUBSIDIARIES