Yahoo 2009 Annual Report Download - page 111
Download and view the complete annual report
Please find page 111 of the 2009 Yahoo annual report below. You can navigate through the pages in the report by either clicking on the pages listed below, or by using the keyword search tool below to find specific information within the annual report.-
 1
1 -
2
-
3
-
4
-
5
-
6
-
7
-
8
-
9
-
10
-
11
-
12
-
13
-
14
-
15
-
16
-
17
-
18
-
19
-
20
-
21
-
22
-
23
-
24
-
25
-
26
-
27
-
28
-
29
-
30
-
31
-
32
-
33
-
34
-
35
-
36
-
37
-
38
-
39
-
40
-
41
-
42
-
43
-
44
-
45
-
46
-
47
-
48
-
49
-
50
-
51
-
52
-
53
-
54
-
55
-
56
-
57
-
58
-
59
-
60
-
61
-
62
-
63
-
64
-
65
-
66
-
67
-
68
-
69
-
70
-
71
-
72
-
73
-
74
-
75
-
76
-
77
-
78
-
79
-
80
-
81
-
82
-
83
-
84
-
85
-
86
-
87
-
88
-
89
-
90
-
91
-
92
-
93
-
94
-
95
-
96
-
97
-
98
-
99
-
100
-
 101
101 -
 102
102 -
 103
103 -
 104
104 -
 105
105 -
 106
106 -
 107
107 -
 108
108 -
 109
109 -
 110
110 -
 111
111 -
 112
112 -
 113
113 -
 114
114 -
 115
115 -
 116
116 -
 117
117 -
 118
118 -
 119
119 -
 120
120 -
 121
121 -
122
-
123
-
124
-
125
-
126
-
127
-
128
-
129
-
130
-
131
-
132
-
133
-
134
 |
 |

Yahoo! Inc.
Notes to Consolidated Financial Statements—(Continued)
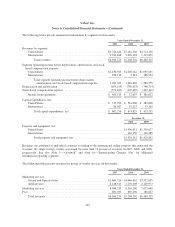
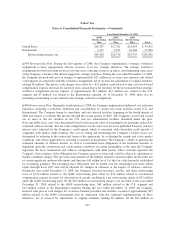
The following tables present summarized information by segment (in thousands):
Years Ended December 31,
2007 2008 2009
Revenues by segment:
United States ........................................... $4,724,426 $5,182,308 $4,714,436
International ........................................... 2,244,848 2,026,194 1,745,879
Total revenues ...................................... $6,969,274 $7,208,502 $6,460,315
Segment operating income before depreciation, amortization, and stock-
based compensation expense:
United States ........................................... $1,430,923 $1,205,262 $1,095,601
International ........................................... 496,112 5,341 486,954
Total segment operating income before depreciation,
amortization, and stock-based compensation expense: ..... 1,927,035 1,210,603 1,582,555
Depreciation and amortization ................................. (659,195) (790,033) (746,714)
Stock-based compensation expense ............................. (572,427) (407,607) (449,149)
Income from operations .................................. $ 695,413 $ 12,693 $ 386,692
Capital expenditures, net:
United States ........................................... $ 515,709 $ 581,906 $ 380,626
International ........................................... 86,567 92,923 53,169
Total capital expenditures, net ......................... $ 602,276 $ 674,829 $ 433,795
December 31,
2008 2009
Property and equipment, net:
United States ...................................................... $1,396,031 $1,310,677
International ...................................................... 140,150 116,185
Total property and equipment, net ................................. $1,536,181 $1,426,862
Revenues are attributed to individual countries according to the international online property that generated the
revenues. No single foreign country accounted for more than 10 percent of revenues in 2007, 2008, and 2009,
respectively. See also Note 5—“Goodwill” and Note 16—“Restructuring Charges, Net” for additional
information regarding segments.
The following table presents revenues for groups of similar services (in thousands):
Years Ended December 31,
2007 2008 2009
Marketing services:
Owned and Operated sites ................................. $3,669,724 $4,046,001 $3,552,695
Affiliate sites ........................................... 2,418,515 2,270,205 2,120,973
Marketing services .......................................... 6,088,239 6,316,206 5,673,668
Fees ...................................................... 881,035 892,296 786,647
Total revenues .......................................... $6,969,274 $7,208,502 $6,460,315
103