Yahoo 2009 Annual Report Download - page 63
Download and view the complete annual report
Please find page 63 of the 2009 Yahoo annual report below. You can navigate through the pages in the report by either clicking on the pages listed below, or by using the keyword search tool below to find specific information within the annual report.-
 1
1 -
2
-
3
-
4
-
5
-
6
-
7
-
8
-
9
-
10
-
11
-
12
-
13
-
14
-
15
-
16
-
17
-
18
-
19
-
20
-
21
-
22
-
23
-
24
-
25
-
26
-
27
-
28
-
29
-
30
-
31
-
32
-
33
-
34
-
35
-
36
-
37
-
38
-
39
-
40
-
41
-
42
-
43
-
44
-
45
-
46
-
47
-
48
-
49
-
50
-
51
-
52
-
 53
53 -
 54
54 -
 55
55 -
 56
56 -
 57
57 -
 58
58 -
 59
59 -
 60
60 -
 61
61 -
 62
62 -
 63
63 -
 64
64 -
 65
65 -
 66
66 -
 67
67 -
 68
68 -
 69
69 -
 70
70 -
 71
71 -
 72
72 -
 73
73 -
74
-
75
-
76
-
77
-
78
-
79
-
80
-
81
-
82
-
83
-
84
-
85
-
86
-
87
-
88
-
89
-
90
-
91
-
92
-
93
-
94
-
95
-
96
-
97
-
98
-
99
-
100
-
101
-
102
-
103
-
104
-
105
-
106
-
107
-
108
-
109
-
110
-
111
-
112
-
113
-
114
-
115
-
116
-
117
-
118
-
119
-
120
-
121
-
122
-
123
-
124
-
125
-
126
-
127
-
128
-
129
-
130
-
131
-
132
-
133
-
134
 |
 |
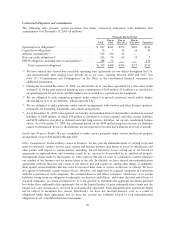
Foreign Currency Risk. Revenues and related expenses generated from our international subsidiaries are
generally denominated in the currencies of the local countries. Primary currencies include Australian dollars,
British pounds, Euros, Korean won, and Taiwan dollars. The statements of income of our international operations
are translated into U.S. dollars at exchange rates indicative of market rates during each applicable period. To the
extent the U.S. dollar strengthens against foreign currencies, the translation of these foreign currency-
denominated transactions results in reduced revenues, operating expenses, and net income for our International
segment. Similarly, our revenues, operating expenses, and net income will increase for our International segment
if the U.S. dollar weakens against foreign currencies. Using the foreign currency exchange rates from 2008, our
international revenues for 2009 would have been higher than we reported by approximately $176 million and our
International segment operating income before depreciation, amortization, and stock-based compensation
expense would have been higher than we reported by $18 million.
We are also exposed to foreign exchange rate fluctuations as we convert the financial statements of our foreign
subsidiaries and our investments in equity interests into U.S. dollars in consolidation. If there is a change in
foreign currency exchange rates, the conversion of the foreign subsidiaries’ financial statements into U.S. dollars
results in a gain or loss which is recorded as a component of accumulated other comprehensive income which is
part of stockholders’ equity. In addition, we have certain assets and liabilities that are denominated in currencies
other than the respective entity’s functional currency. Changes in the functional currency value of these assets
and liabilities create fluctuations that will lead to a gain or loss. We record these foreign currency transaction
gains and losses, realized and unrealized, in other income, net on the consolidated statements of income. During
2009, our net realized and unrealized foreign currency transaction loss was not material. During 2008 and 2007,
we recorded realized and unrealized foreign currency transaction net losses of $25 million and foreign currency
transaction net gains of $7 million, respectively.
Investment Risk. We are exposed to investment risk as it relates to changes in the market value of our
investments.
We have investments in marketable debt securities. Our cash and debt investment policy and strategy attempt
primarily to preserve capital and meet liquidity requirements. A large portion of our cash is managed by external
managers within the guidelines of our investment policy. We protect and preserve invested funds by limiting
default, market, and reinvestment risk. To achieve this objective, we maintain our portfolio of cash and cash
equivalents and short-term and long-term investments in a variety of liquid fixed income securities, including
both government and corporate obligations and money market funds. As of December 31, 2009 and 2008, net
unrealized gains and losses on these investments were not material.
We invest in equity instruments of public companies for business and strategic purposes and have classified these
securities as available-for-sale or investment in equity interests. These investments may be subject to significant
fluctuations in fair value due to the volatility of the stock market and the industries in which these companies
participate. Our investments in available-for-sale equity securities amounted to $3 million and $87 million,
respectively, as of December 31, 2009 and 2008. During the year ended December 31, 2009, we realized gains of
$67 million related to the sale of our investment in Gmarket. Our realized gains and losses from the sale of
available-for-sale investments were not material in 2008. During the year ended December 31, 2008, we recorded
an other-than-temporary impairment charge of $30 million, net of tax, within earnings in equity interests to
reduce the carrying value of our direct investment in Alibaba.com to fair value. During the year ended
December 31, 2009, we sold our direct investment in Alibaba.com for net proceeds of $145 million and recorded
a pre-tax gain of $98 million in other income, net.
Our objective in managing exposure to stock market fluctuations is to minimize the impact of stock market
declines to earnings and cash flows. Using a hypothetical reduction of 10 percent in the stock price of these
available-for-sale investments, the fair value of our equity investments would decrease by less than $1 million as
of December 31, 2009 and $9 million as of December 31, 2008.
55