Yahoo 2009 Annual Report Download - page 88
Download and view the complete annual report
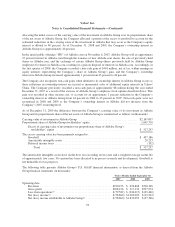
Please find page 88 of the 2009 Yahoo annual report below. You can navigate through the pages in the report by either clicking on the pages listed below, or by using the keyword search tool below to find specific information within the annual report.-
 1
1 -
2
-
3
-
4
-
5
-
6
-
7
-
8
-
9
-
10
-
11
-
12
-
13
-
14
-
15
-
16
-
17
-
18
-
19
-
20
-
21
-
22
-
23
-
24
-
25
-
26
-
27
-
28
-
29
-
30
-
31
-
32
-
33
-
34
-
35
-
36
-
37
-
38
-
39
-
40
-
41
-
42
-
43
-
44
-
45
-
46
-
47
-
48
-
49
-
50
-
51
-
52
-
53
-
54
-
55
-
56
-
57
-
58
-
59
-
60
-
61
-
62
-
63
-
64
-
65
-
66
-
67
-
68
-
69
-
70
-
71
-
72
-
73
-
74
-
75
-
76
-
77
-
 78
78 -
 79
79 -
 80
80 -
 81
81 -
 82
82 -
 83
83 -
 84
84 -
 85
85 -
 86
86 -
 87
87 -
 88
88 -
 89
89 -
 90
90 -
 91
91 -
 92
92 -
 93
93 -
 94
94 -
 95
95 -
 96
96 -
 97
97 -
 98
98 -
99
-
100
-
101
-
102
-
103
-
104
-
105
-
106
-
107
-
108
-
109
-
110
-
111
-
112
-
113
-
114
-
115
-
116
-
117
-
118
-
119
-
120
-
121
-
122
-
123
-
124
-
125
-
126
-
127
-
128
-
129
-
130
-
131
-
132
-
133
-
134
 |
 |

Yahoo! Inc.
Notes to Consolidated Financial Statements—(Continued)
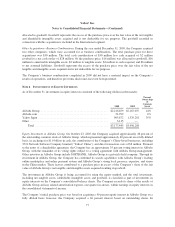
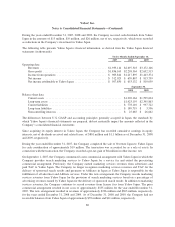
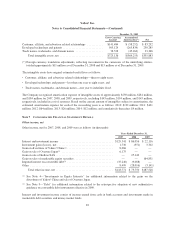
During the years ended December 31, 2007, 2008 and 2009, the Company received cash dividends from Yahoo
Japan in the amounts of $15 million, $19 million, and $26 million, net of tax, respectively, which were recorded
as reductions in the Company’s investment in Yahoo Japan.
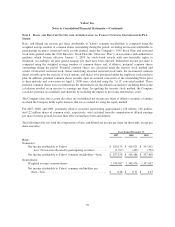
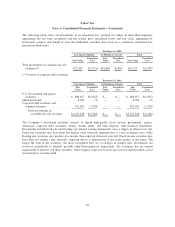
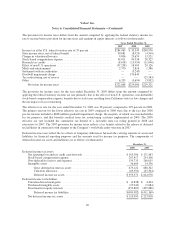
The following table presents Yahoo Japan’s financial information, as derived from the Yahoo Japan financial
statements (in thousands):
Twelve Months Ended September 30,
2007 2008 2009
Operating data:
Revenues .............................................. $1,933,114 $2,697,518 $3,172,106
Gross profit ............................................ $1,836,169 $2,298,364 $2,652,513
Income from operations .................................. $ 983,844 $1,217,895 $1,443,374
Net income ............................................ $ 512,023 $ 659,867 $ 813,759
Net income attributable to Yahoo Japan ...................... $ 507,850 $ 653,132 $ 810,059
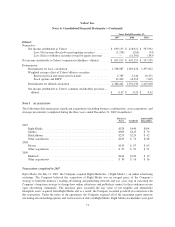
September 30,
2008 2009
Balance sheet data:
Current assets ..................................................... $1,202,164 $1,599,624
Long-term assets ................................................... $1,923,195 $2,395,863
Current liabilities ................................................... $ 778,110 $ 997,722
Long-term liabilities ................................................ $ 189,719 $ 3,556
Noncontrolling interests ............................................. $ 25,665 $ 26,662
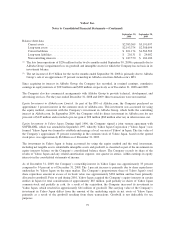
The differences between U.S. GAAP and accounting principles generally accepted in Japan, the standards by
which Yahoo Japan’s financial statements are prepared, did not materially impact the amounts reflected in the
Company’s consolidated financial statements.
Since acquiring its equity interest in Yahoo Japan, the Company has recorded cumulative earnings in equity
interests, net of dividends received and related taxes, of $801 million and $1.1 billion as of December 31, 2008
and 2009, respectively.
During the year ended December 31, 2007, the Company completed the sale of Overture Japan to Yahoo Japan
for cash consideration of approximately $19 million. The transaction was accounted for as a sale of assets. In
connection with the transaction, the Company recorded a pre-tax gain of $6 million in other income, net.
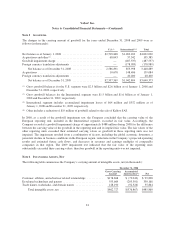
On September 1, 2007, the Company commenced a new commercial arrangement with Yahoo Japan in which the
Company provides search marketing services to Yahoo Japan for a service fee and exited the pre-existing
commercial arrangement. Previously, the Company earned marketing services revenues from advertisers and
paid TAC to Yahoo Japan. The Company no longer recognizes marketing services revenues and TAC for the
delivery of sponsored search results and payments to Affiliates in Japan as Yahoo Japan is responsible for the
fulfillment of all advertiser and Affiliate services. Under this new arrangement, the Company records marketing
services revenues from Yahoo Japan for the provision of search marketing services based on a percentage of
advertising revenues earned by Yahoo Japan for the delivery of sponsored search results. In addition to marketing
services revenues, the Company continues to record revenues from license fees from Yahoo Japan. The prior
commercial arrangement resulted in net costs of approximately $135 million for the year ended December 31,
2007. The new arrangement resulted in revenues of approximately $296 million and $303 million, respectively,
for the years ended December 31, 2008 and 2009. As of December 31, 2008 and 2009, the Company had net
receivable balances from Yahoo Japan of approximately $39 million and $41 million, respectively.
80