Yahoo 2009 Annual Report Download - page 46
Download and view the complete annual report
Please find page 46 of the 2009 Yahoo annual report below. You can navigate through the pages in the report by either clicking on the pages listed below, or by using the keyword search tool below to find specific information within the annual report.-
 1
1 -
2
-
3
-
4
-
5
-
6
-
7
-
8
-
9
-
10
-
11
-
12
-
13
-
14
-
15
-
16
-
17
-
18
-
19
-
20
-
21
-
22
-
23
-
24
-
25
-
26
-
27
-
28
-
29
-
30
-
31
-
32
-
33
-
34
-
35
-
 36
36 -
 37
37 -
 38
38 -
 39
39 -
 40
40 -
 41
41 -
 42
42 -
 43
43 -
 44
44 -
 45
45 -
 46
46 -
 47
47 -
 48
48 -
 49
49 -
 50
50 -
 51
51 -
 52
52 -
 53
53 -
 54
54 -
 55
55 -
 56
56 -
57
-
58
-
59
-
60
-
61
-
62
-
63
-
64
-
65
-
66
-
67
-
68
-
69
-
70
-
71
-
72
-
73
-
74
-
75
-
76
-
77
-
78
-
79
-
80
-
81
-
82
-
83
-
84
-
85
-
86
-
87
-
88
-
89
-
90
-
91
-
92
-
93
-
94
-
95
-
96
-
97
-
98
-
99
-
100
-
101
-
102
-
103
-
104
-
105
-
106
-
107
-
108
-
109
-
110
-
111
-
112
-
113
-
114
-
115
-
116
-
117
-
118
-
119
-
120
-
121
-
122
-
123
-
124
-
125
-
126
-
127
-
128
-
129
-
130
-
131
-
132
-
133
-
134
 |
 |

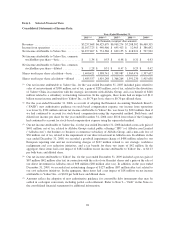
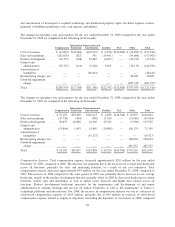
and amortization of developed or acquired technology and intellectual property rights. Facilities expense consists
primarily of building maintenance costs, rent expense, and utilities.
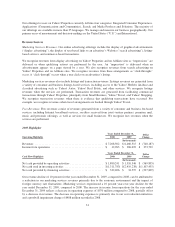
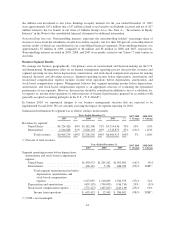
The changes in operating costs and expenses for the year ended December 31, 2009 compared to the year ended
December 31, 2008 are comprised of the following (in thousands):
Compensation
Information
Technology
Depreciation and
Amortization Facilities TAC Other Total
Cost of revenues .......... $ (12,822) $(26,064) $(34,517) $ (2,226) $(32,088) $ (43,899) $ (151,616)
Sales and marketing ....... (202,630) (827) 541 (19,441) — (95,606) (317,963)
Product development ...... (14,735) (188) 34,462 (6,367) — (24,791) (11,619)
General and
administrative .......... (50,767) (110) (3,228) 5,492 — (76,171) (124,784)
Amortization of
intangibles ............ — — (48,444) — — — (48,444)
Restructuring charges, net . . — — — — — 20,047 20,047
Goodwill impairment
charge ................ — — — — — (487,537) (487,537)
Total ................... $(280,954) $(27,189) $(51,186) $(22,542) $(32,088) $(707,957) $(1,121,916)
The changes in operating costs and expenses for the year ended December 31, 2008 compared to the year ended
December 31, 2007 are comprised of the following (in thousands):
Compensation
Information
Technology
Depreciation and
Amortization Facilities TAC Other Total
Cost of revenues .......... $25,103 $53,828 $120,115 $ 2,689 $(46,786) $ 29,655 $184,604
Sales and marketing ....... (47,736) (444) (905) 17,010 — (14,969) (47,044)
Product development ...... 90,679 10,830 16,505 25,525 — (5,990) 137,549
General and
administrative .......... (13,864) 1,643 14,650 (30,898) — 100,174 71,705
Amortization of
intangibles ............ — — (19,527) — — — (19,527)
Restructuring charges, net . . — — — — — 106,854 106,854
Goodwill impairment
charge ................ — — — — — 487,537 487,537
Total ................... $54,182 $65,857 $130,838 $ 14,326 $(46,786) $703,261 $921,678
Compensation Expense. Total compensation expense decreased approximately $281 million for the year ended
December 31, 2009, compared to 2008. The decrease was primarily due to decreases in our average total headcount
across all functions, primarily the sales and marketing function, as a result of our cost initiatives. Total
compensation expense increased approximately $54 million for the year ended December 31, 2008, compared to
2007. The increase in 2008 compared to the same period of 2007 was primarily due to increases in our average
headcount, mainly in the product development function (partially offset in 2008 by decreased headcount in certain
functions, mainly sales and marketing), as well as annual salary increases and higher base salaries across all
functions. Product development headcount increased for the maintenance and development of and minor
enhancements to existing offerings and services on Yahoo! Properties as well as the maintenance of Yahoo!’s
technology platforms and infrastructure. For 2008, the increase in compensation expense was net of a decrease in
stock-based compensation expense of $165 million, primarily due to $30 million in reversals of stock-based
compensation expense related to employee departures (including the departure of executives) in 2008, compared
38