Yahoo 2009 Annual Report Download - page 44
Download and view the complete annual report
Please find page 44 of the 2009 Yahoo annual report below. You can navigate through the pages in the report by either clicking on the pages listed below, or by using the keyword search tool below to find specific information within the annual report.-
 1
1 -
2
-
3
-
4
-
5
-
6
-
7
-
8
-
9
-
10
-
11
-
12
-
13
-
14
-
15
-
16
-
17
-
18
-
19
-
20
-
21
-
22
-
23
-
24
-
25
-
26
-
27
-
28
-
29
-
30
-
31
-
32
-
33
-
 34
34 -
 35
35 -
 36
36 -
 37
37 -
 38
38 -
 39
39 -
 40
40 -
 41
41 -
 42
42 -
 43
43 -
 44
44 -
 45
45 -
 46
46 -
 47
47 -
 48
48 -
 49
49 -
 50
50 -
 51
51 -
 52
52 -
 53
53 -
 54
54 -
55
-
56
-
57
-
58
-
59
-
60
-
61
-
62
-
63
-
64
-
65
-
66
-
67
-
68
-
69
-
70
-
71
-
72
-
73
-
74
-
75
-
76
-
77
-
78
-
79
-
80
-
81
-
82
-
83
-
84
-
85
-
86
-
87
-
88
-
89
-
90
-
91
-
92
-
93
-
94
-
95
-
96
-
97
-
98
-
99
-
100
-
101
-
102
-
103
-
104
-
105
-
106
-
107
-
108
-
109
-
110
-
111
-
112
-
113
-
114
-
115
-
116
-
117
-
118
-
119
-
120
-
121
-
122
-
123
-
124
-
125
-
126
-
127
-
128
-
129
-
130
-
131
-
132
-
133
-
134
 |
 |
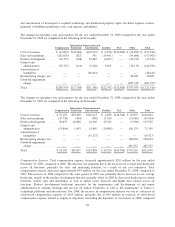
We expect marketing services revenues from Affiliate sites for the first quarter of 2010 to remain relatively flat
compared to the first quarter of 2009 as we continue to implement our ongoing advertiser quality initiatives.
Fees Revenues. Our fees revenues include premium fee-based services such as services for small businesses,
Internet broadband services, premium e-mail, sports, photos, games, personals, and music. Other fee-based
revenues include royalties, licenses, and mobile services.
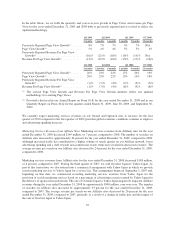
For the year ended December 31, 2009, fees revenues decreased approximately $106 million, or 12 percent,
compared to 2008. For the year ended December 31, 2008, fees revenues increased approximately $11 million, or
1 percent, compared to 2007. The fluctuations were primarily attributed to changes in certain of our broadband
access partnerships, from being fee-paying user based to an advertising revenue sharing model, as well as the
outsourcing of the voice over internet protocol, or VOIP, subscription music businesses, and other business lines.
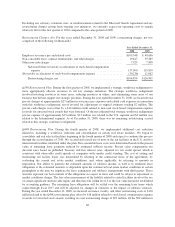
Due to these factors and the renewed focus on our display and search revenues, we expect fees revenues to
continue to decline for the first quarter of 2010, compared to the first quarter of 2009.
As used in this discussion, “fee-paying users” is based on the total number of fee-based subscriptions aggregated
from each Yahoo! Property. To calculate the average revenue per fee-paying user, we divide the revenue
generated from the subscriptions by the average fee-paying users during the year.
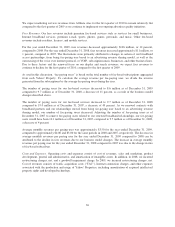
The number of paying users for our fee-based services decreased to 8.6 million as of December 31, 2009
compared to 9.7 million as of December 31, 2008, a decrease of 11 percent, as a result of the business model
changes described above.
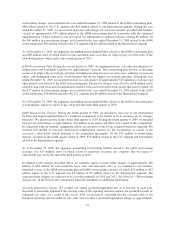
The number of paying users for our fee-based services decreased to 9.7 million as of December 31, 2008
compared to 19.0 million as of December 31, 2007, a decrease of 49 percent. As we renewed contracts with
broadband partners and our relationships moved from being fee-paying user based to an advertising revenue
sharing model, our number of fee-paying users decreased. Adjusting the number of fee-paying users as of
December 31, 2007 to remove fee-paying users related to our renewed broadband relationships, our fee-paying
users would have been 10.1 million as of December 31, 2007, compared to 9.7 million as of December 31, 2008,
a decrease of 4 percent.
Average monthly revenues per paying user was approximately $3.50 for the year ended December 31, 2009,
compared to approximately $4.00 and $3.00 for the same periods in 2008 and 2007, respectively. The decrease in
average monthly revenues per paying user for the year ended December 31, 2009 compared to 2008 can be
attributed to the decline in fees revenues due to our business model changes. The increase in average monthly
revenues per paying user for the year ended December 31, 2008 compared to 2007 was due to the change in mix
of fee-based subscribers.
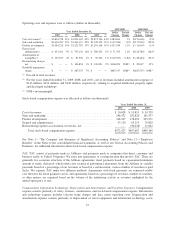
Costs and Expenses. Operating costs and expenses consist of cost of revenues, sales and marketing, product
development, general and administrative, and amortization of intangible assets. In addition, in 2008, we incurred
restructuring charges, net, and a goodwill impairment charge. In 2009, we incurred restructuring charges, net.
Cost of revenues consists of traffic acquisition costs (“TAC”), Internet connection charges, and other expenses
associated with the production and usage of Yahoo! Properties, including amortization of acquired intellectual
property rights and developed technology.
36