Yahoo 2009 Annual Report Download - page 93
Download and view the complete annual report
Please find page 93 of the 2009 Yahoo annual report below. You can navigate through the pages in the report by either clicking on the pages listed below, or by using the keyword search tool below to find specific information within the annual report.-
 1
1 -
2
-
3
-
4
-
5
-
6
-
7
-
8
-
9
-
10
-
11
-
12
-
13
-
14
-
15
-
16
-
17
-
18
-
19
-
20
-
21
-
22
-
23
-
24
-
25
-
26
-
27
-
28
-
29
-
30
-
31
-
32
-
33
-
34
-
35
-
36
-
37
-
38
-
39
-
40
-
41
-
42
-
43
-
44
-
45
-
46
-
47
-
48
-
49
-
50
-
51
-
52
-
53
-
54
-
55
-
56
-
57
-
58
-
59
-
60
-
61
-
62
-
63
-
64
-
65
-
66
-
67
-
68
-
69
-
70
-
71
-
72
-
73
-
74
-
75
-
76
-
77
-
78
-
79
-
80
-
81
-
82
-
 83
83 -
 84
84 -
 85
85 -
 86
86 -
 87
87 -
 88
88 -
 89
89 -
 90
90 -
 91
91 -
 92
92 -
 93
93 -
 94
94 -
 95
95 -
 96
96 -
 97
97 -
 98
98 -
 99
99 -
 100
100 -
 101
101 -
 102
102 -
 103
103 -
104
-
105
-
106
-
107
-
108
-
109
-
110
-
111
-
112
-
113
-
114
-
115
-
116
-
117
-
118
-
119
-
120
-
121
-
122
-
123
-
124
-
125
-
126
-
127
-
128
-
129
-
130
-
131
-
132
-
133
-
134
 |
 |

Yahoo! Inc.
Notes to Consolidated Financial Statements—(Continued)
Note 8 I
NVESTMENTS
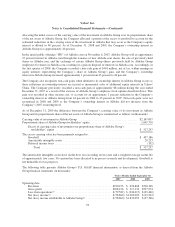
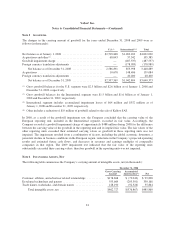
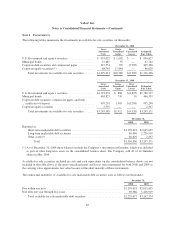
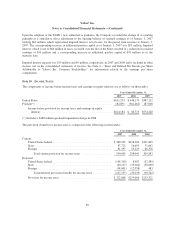
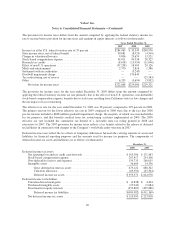
The following tables summarize the investments in available-for-sale securities (in thousands):
December 31, 2008
Gross
Amortized
Costs
Gross
Unrealized
Gains
Gross
Unrealized
Losses
Estimated
Fair Value
U.S. Government and agency securities .................. $ 935,025 $ 1,602 $ — $ 936,627
Municipal bonds .................................... 47,687 55 — 47,742
Corporate debt securities and commercial paper ........... 247,554 739 (2,985) 245,308
Corporate equity securities(*) .......................... 68,745 17,884 — 86,629
Total investments in available-for-sale securities ....... $1,299,011 $20,280 $(2,985) $1,316,306
December 31, 2009
Gross
Amortized
Costs
Gross
Unrealized
Gains
Gross
Unrealized
Losses
Estimated
Fair Value
U.S. Government and agency securities .................. $1,781,674 $ 868 $(1,825) $1,780,717
Municipal bonds .................................... 465,823 739 (3) 466,559
Corporate debt securities, commercial paper, and bank
certificates of deposit ............................... 995,291 1,305 $(1,298) 995,298
Corporate equity securities ............................ 2,597 — — 2,597
Total investments in available-for-sale securities ....... $3,245,385 $2,912 $(3,126) $3,245,171
December 31,
2008 2009
Reported as:
Short-term marketable debt securities ................................... $1,159,691 $2,015,655
Long-term marketable debt securities ................................... 69,986 1,226,919
Other assets(*) ..................................................... 86,629 2,597
Total ........................................................ $1,316,306 $3,245,171
(*) As of December 31, 2008 these balances include the Company’s investment in Gmarket, which was included
as part of other long-term assets in the consolidated balance sheet. The Company sold all of its Gmarket
shares in May 2009.
Available-for-sale securities included in cash and cash equivalents on the consolidated balance sheets are not
included in the table above as the gross unrealized gains and losses were immaterial for both 2008 and 2009 as
the carrying value approximates fair value because of the short maturity of those instruments.
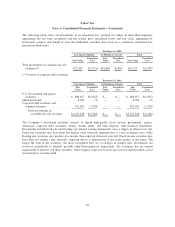
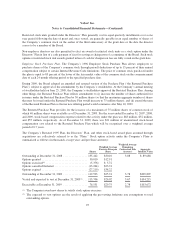
The contractual maturities of available-for-sale marketable debt securities were as follows (in thousands):
December 31,
2008 2009
Due within one year .................................................... $1,159,691 $2,015,655
Due after one year through five years ....................................... 69,986 1,226,919
Total available-for-sale marketable debt securities ........................ $1,229,677 $3,242,574
85