Yahoo 2009 Annual Report Download - page 45
Download and view the complete annual report
Please find page 45 of the 2009 Yahoo annual report below. You can navigate through the pages in the report by either clicking on the pages listed below, or by using the keyword search tool below to find specific information within the annual report.-
 1
1 -
2
-
3
-
4
-
5
-
6
-
7
-
8
-
9
-
10
-
11
-
12
-
13
-
14
-
15
-
16
-
17
-
18
-
19
-
20
-
21
-
22
-
23
-
24
-
25
-
26
-
27
-
28
-
29
-
30
-
31
-
32
-
33
-
34
-
 35
35 -
 36
36 -
 37
37 -
 38
38 -
 39
39 -
 40
40 -
 41
41 -
 42
42 -
 43
43 -
 44
44 -
 45
45 -
 46
46 -
 47
47 -
 48
48 -
 49
49 -
 50
50 -
 51
51 -
 52
52 -
 53
53 -
 54
54 -
 55
55 -
56
-
57
-
58
-
59
-
60
-
61
-
62
-
63
-
64
-
65
-
66
-
67
-
68
-
69
-
70
-
71
-
72
-
73
-
74
-
75
-
76
-
77
-
78
-
79
-
80
-
81
-
82
-
83
-
84
-
85
-
86
-
87
-
88
-
89
-
90
-
91
-
92
-
93
-
94
-
95
-
96
-
97
-
98
-
99
-
100
-
101
-
102
-
103
-
104
-
105
-
106
-
107
-
108
-
109
-
110
-
111
-
112
-
113
-
114
-
115
-
116
-
117
-
118
-
119
-
120
-
121
-
122
-
123
-
124
-
125
-
126
-
127
-
128
-
129
-
130
-
131
-
132
-
133
-
134
 |
 |

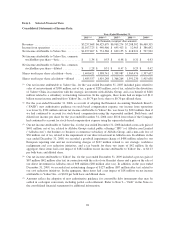
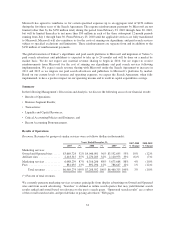
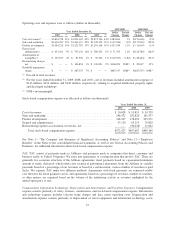
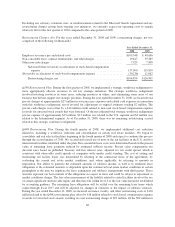
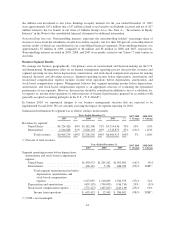
Operating costs and expenses were as follows (dollars in thousands):
Year Ended December 31,
2007-2008 2008-2009
Dollar
Change
Percent
Change
Dollar
Change
Percent
Change2007 (1) 2008 (1) 2009 (1)
Cost of revenues(2) ...... $2,838,758 41% $3,023,362 42% $2,871,746 44% $184,604 7% $(151,616) (5)%
Sales and marketing ..... $1,610,357 23% $1,563,313 22% $1,245,350 19% $ (47,044) (3)% $(317,963) (20)%
Product development .... $1,084,238 16% $1,221,787 17% $1,210,168 19% $137,549 13% $ (11,619) (1)%
General and
administrative ........ $ 633,431 9% $ 705,136 10% $ 580,352 9% $ 71,705 11% $(124,784) (18)%
Amortization of
intangibles(2) ......... $ 107,077 2% $ 87,550 1% $ 39,106 1% $ (19,527) (18)% $ (48,444) (55)%
Restructuring charges,
net................. $ — — $ 106,854 1% $ 126,901 2% $106,854 N/M(3) $ 20,047 19%
Goodwill impairment
charge .............. $ — — $ 487,537 7% $ — — $487,537 N/M(3) $(487,537) N/M(3)
(1) Percent of total revenues.
(2) For the years ended December 31, 2009, 2008, and 2007, cost of revenues included amortization expense of
$145 million, $194 million, and $143 million, respectively, relating to acquired intellectual property rights
and developed technology.
(3) N/M = not meaningful.
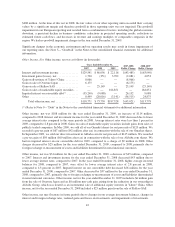
Stock-based compensation expense was allocated as follows (in thousands):
Years Ended December 31,
2007 2008 2009
Cost of revenues ................................................. $ 10,628 $ 13,813 $ 10,759
Sales and marketing .............................................. 246,472 182,826 141,537
Product development ............................................. 218,207 178,091 205,971
General and administrative ........................................ 97,120 63,113 79,820
Restructuring expense accelerations (reversals), net ..................... — (30,236) 11,062
Total stock-based compensation expense ......................... $572,427 $407,607 $449,149
See Note 1—“The Company and Summary of Significant Accounting Policies” and Note 12—“Employee
Benefits” in the Notes to the consolidated financial statements, as well as our Critical Accounting Policies and
Estimates, for additional information about stock-based compensation expense.
TAC. TAC consist of payments made to Affiliates and payments made to companies that direct consumer and
business traffic to Yahoo! Properties. We enter into agreements of varying duration that involve TAC. There are
generally two economic structures of the Affiliate agreements: fixed payments based on a guaranteed minimum
amount of traffic delivered, which often carry reciprocal performance guarantees from the Affiliate or variable
payments based on a percentage of our revenues or based on a certain metric, such as number of searches or paid
clicks. We expense TAC under two different methods. Agreements with fixed payments are expensed ratably
over the term the fixed payment covers, and agreements based on a percentage of revenues, number of searches,
or other metrics are expensed based on the volume of the underlying activity or revenues multiplied by the
agreed-upon price or rate.
Compensation, Information Technology, Depreciation and Amortization, and Facilities Expenses. Compensation
expense consists primarily of salary, bonuses, commissions, and stock-based compensation expense. Information
and technology expense includes telecom usage charges and data center operating costs. Depreciation and
amortization expense consists primarily of depreciation of server equipment and information technology assets
37