Yahoo 2009 Annual Report Download - page 36
Download and view the complete annual report
Please find page 36 of the 2009 Yahoo annual report below. You can navigate through the pages in the report by either clicking on the pages listed below, or by using the keyword search tool below to find specific information within the annual report.-
 1
1 -
2
-
3
-
4
-
5
-
6
-
7
-
8
-
9
-
10
-
11
-
12
-
13
-
14
-
15
-
16
-
17
-
18
-
19
-
20
-
21
-
22
-
23
-
24
-
25
-
 26
26 -
 27
27 -
 28
28 -
 29
29 -
 30
30 -
 31
31 -
 32
32 -
 33
33 -
 34
34 -
 35
35 -
 36
36 -
 37
37 -
 38
38 -
 39
39 -
 40
40 -
 41
41 -
 42
42 -
 43
43 -
 44
44 -
 45
45 -
 46
46 -
47
-
48
-
49
-
50
-
51
-
52
-
53
-
54
-
55
-
56
-
57
-
58
-
59
-
60
-
61
-
62
-
63
-
64
-
65
-
66
-
67
-
68
-
69
-
70
-
71
-
72
-
73
-
74
-
75
-
76
-
77
-
78
-
79
-
80
-
81
-
82
-
83
-
84
-
85
-
86
-
87
-
88
-
89
-
90
-
91
-
92
-
93
-
94
-
95
-
96
-
97
-
98
-
99
-
100
-
101
-
102
-
103
-
104
-
105
-
106
-
107
-
108
-
109
-
110
-
111
-
112
-
113
-
114
-
115
-
116
-
117
-
118
-
119
-
120
-
121
-
122
-
123
-
124
-
125
-
126
-
127
-
128
-
129
-
130
-
131
-
132
-
133
-
134
 |
 |

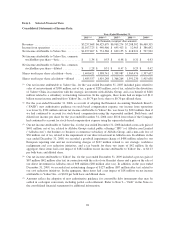
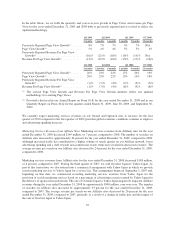
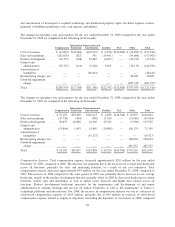
Item 6. Selected Financial Data
Consolidated Statements of Income Data:
Years Ended December 31,
2005(1)(5) 2006(2)(5) 2007(5) 2008(3)(5) 2009(4)
(In thousands, except per share amounts)
Revenues ................................ $5,257,668 $6,425,679 $6,969,274 $7,208,502 $6,460,315
Income from operations .................... $1,107,725 $ 940,966 $ 695,413 $ 12,963 $ 386,692
Net income attributable to Yahoo! Inc. ......... $1,877,407 $ 731,568 $ 639,155 $ 418,921 $ 597,992
Net income attributable to Yahoo! Inc. common
stockholders per share—basic .............. $ 1.34 $ 0.53 $ 0.48 $ 0.31 $ 0.43
Net income attributable to Yahoo! Inc. common
stockholders per share—diluted ............ $ 1.28 $ 0.51 $ 0.47 $ 0.29 $ 0.42
Shares used in per share calculation—basic ..... 1,400,421 1,388,741 1,338,987 1,369,476 1,397,652
Shares used in per share calculation—diluted . . . 1,485,557 1,419,248 1,366,264 1,391,230 1,415,658
(1) Our net income attributable to Yahoo! Inc. for the year ended December 31, 2005 included gains related to
sales of an investment of $580 million, net of tax; a gain of $205 million, net of tax, related to the divestiture
of Yahoo! China in connection with the strategic investment with Alibaba Group; and a tax benefit of $248
million related to a subsidiary restructuring transaction. In the aggregate, these items had an impact of $1.0
billion on net income attributable to Yahoo! Inc., or $0.74 per basic share or $0.70 per diluted share.
(2) For the year ended December 31, 2006, as a result of adopting the Financial Accounting Standards Board’s
(“FASB”) new authoritative guidance on stock-based compensation expense, our income from operations
was lower by $324 million and our net income attributable to Yahoo! Inc. was lower by $222 million, than if
we had continued to account for stock-based compensation using the superseded method. Both basic and
diluted net income per share for the year ended December 31, 2006 were $0.16 lower than if the Company
had continued to account for stock-based compensation expense using the superseded method.
(3) Our net income attributable to Yahoo! Inc. for the year ended December 31, 2008 included a non-cash gain of
$401 million, net of tax, related to Alibaba Group’s initial public offering (“IPO”) of Alibaba.com Limited
(“Alibaba.com”), the business to business e-commerce subsidiary of Alibaba Group, and a non-cash loss of
$30 million, net of tax, related to the impairment of our direct investment in Alibaba.com. In addition, in the
year ended December 31, 2008, we recorded a goodwill impairment charge of $488 million related to our
European reporting unit and net restructuring charges of $107 million related to our strategic workforce
realignment and cost reduction initiatives, and a tax benefit for these two items of $42 million. In the
aggregate, these items had a net impact of $182 million on net income attributable to Yahoo! Inc., or $0.13
per both basic and diluted share.
(4) Our net income attributable to Yahoo! Inc. for the year ended December 31, 2009 included a pre-tax gain of
$67 million ($42 million after tax) in connection with the sale of our Gmarket shares and a gain on the sale of
our direct investment in Alibaba.com of $98 million ($60 million after tax). In addition, in the year ended
December 31, 2009, we recorded net restructuring charges of $127 million ($87 million after tax) related to
our cost reduction initiatives. In the aggregate, these items had a net impact of $18 million on net income
attributable to Yahoo! Inc., or $0.01 per both basic and diluted share.
(5) Amounts reflect the adoption of new authoritative guidance for convertible debt instruments that may be
settled in cash upon conversion, including partial cash settlement. Refer to Note 9—“Debt” in the Notes to
the consolidated financial statements for additional information.
28