Yahoo 2009 Annual Report Download - page 55
Download and view the complete annual report
Please find page 55 of the 2009 Yahoo annual report below. You can navigate through the pages in the report by either clicking on the pages listed below, or by using the keyword search tool below to find specific information within the annual report.-
 1
1 -
2
-
3
-
4
-
5
-
6
-
7
-
8
-
9
-
10
-
11
-
12
-
13
-
14
-
15
-
16
-
17
-
18
-
19
-
20
-
21
-
22
-
23
-
24
-
25
-
26
-
27
-
28
-
29
-
30
-
31
-
32
-
33
-
34
-
35
-
36
-
37
-
38
-
39
-
40
-
41
-
42
-
43
-
44
-
 45
45 -
 46
46 -
 47
47 -
 48
48 -
 49
49 -
 50
50 -
 51
51 -
 52
52 -
 53
53 -
 54
54 -
 55
55 -
 56
56 -
 57
57 -
 58
58 -
 59
59 -
 60
60 -
 61
61 -
 62
62 -
 63
63 -
 64
64 -
 65
65 -
66
-
67
-
68
-
69
-
70
-
71
-
72
-
73
-
74
-
75
-
76
-
77
-
78
-
79
-
80
-
81
-
82
-
83
-
84
-
85
-
86
-
87
-
88
-
89
-
90
-
91
-
92
-
93
-
94
-
95
-
96
-
97
-
98
-
99
-
100
-
101
-
102
-
103
-
104
-
105
-
106
-
107
-
108
-
109
-
110
-
111
-
112
-
113
-
114
-
115
-
116
-
117
-
118
-
119
-
120
-
121
-
122
-
123
-
124
-
125
-
126
-
127
-
128
-
129
-
130
-
131
-
132
-
133
-
134
 |
 |

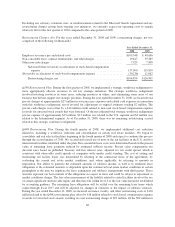
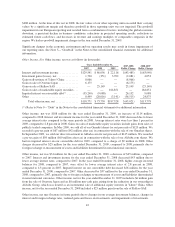
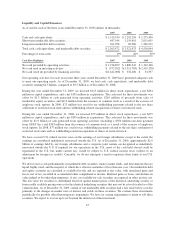
Liquidity and Capital Resources
As of and for each of the three years ended December 31, 2009 (dollars in thousands):
2007 2008 2009
Cash and cash equivalents ................................... $1,513,930 $ 2,292,296 $ 1,275,430
Short-term marketable debt securities .......................... 487,544 1,159,691 2,015,655
Long-term marketable debt securities .......................... 361,998 69,986 1,226,919
Total cash, cash equivalents, and marketable debt securities ........ $2,363,472 $ 3,521,973 $ 4,518,004
Percentage of total assets ................................... 19% 26% 30%
Cash Flow Highlights 2007 2008 2009
Net cash provided by operating activities ....................... $1,918,899 $ 1,880,241 $ 1,310,346
Net cash used in investing activities ........................... $ (572,502) $(1,311,783) $(2,419,238)
Net cash (used in) provided by financing activities ............... $(1,442,008) $ 332,406 $ 34,597
Our operating activities for each year in the three years ended December 31, 2009 have generated adequate cash
to meet our operating needs. As of December 31, 2009, we had cash, cash equivalents, and marketable debt
securities totaling $4.5 billion, compared to $3.5 billion as of December 31, 2008.
During the year ended December 31, 2009, we invested $113 million in direct stock repurchases, a net $434
million in capital expenditures, and a net $195 million in acquisitions. The cash used for these investments was
offset by $1.3 billion of cash generated from operating activities, $265 million of proceeds from sales of
marketable equity securities, and $113 million from the issuance of common stock as a result of the exercise of
employee stock options. In 2009, $73 million was used for tax withholding payments related to the net share
settlement of restricted stock units and tax withholding-related reacquisition of shares of restricted stock.
During the year ended December 31, 2008, we invested $79 million in direct stock repurchases, a net $675
million in capital expenditures, and a net $209 million in acquisitions. The cash used for these investments was
offset by $1.9 billion of cash generated from operating activities (including a $350 million one-time payment
from AT&T Inc.) and $363 million from the issuance of common stock as a result of the exercise of employee
stock options. In 2008, $77 million was used for tax withholding payments related to the net share settlement of
restricted stock units and tax withholding-related reacquisition of shares of restricted stock.
We have accrued U.S. federal income taxes on the earnings of our foreign subsidiaries except to the extent the
earnings are considered indefinitely reinvested outside the U.S. As of December 31, 2009, approximately $2.0
billion of earnings held by our foreign subsidiaries and a corporate joint venture are designated as indefinitely
reinvested outside the U.S. If required for our operations in the U.S., most of the cash held abroad could be
repatriated to the U.S. but, under current law, would be subject to U.S. federal income taxes (subject to an
adjustment for foreign tax credits). Currently, we do not anticipate a need to repatriate these funds to our U.S.
operations.
We invest excess cash predominantly in marketable debt securities, money market funds, and time deposits that are
liquid, highly rated, and the majority of which have effective maturities of less than one year. Our marketable debt
and equity securities are classified as available-for-sale and are reported at fair value, with unrealized gains and
losses, net of tax, recorded in accumulated other comprehensive income. Realized gains or losses and declines in
value judged to be other-than-temporary, if any, on available-for-sale securities are reported in other income, net.
The fair value for securities is determined based on quoted market prices of the historical underlying security or
from readily available pricing sources for the identical underlying securities that may not be actively traded as of the
valuation date. As of December 31, 2009, certain of our marketable debt securities had a fair value below cost due
primarily to the changes in market rates of interest and yields on these securities. We evaluate these investments
periodically for possible other-than-temporary impairment. We have no current requirement or intent to sell these
securities. We expect to recover up to (or beyond) the initial cost of the investment.
47