Yahoo 2009 Annual Report Download - page 43
Download and view the complete annual report
Please find page 43 of the 2009 Yahoo annual report below. You can navigate through the pages in the report by either clicking on the pages listed below, or by using the keyword search tool below to find specific information within the annual report.-
 1
1 -
2
-
3
-
4
-
5
-
6
-
7
-
8
-
9
-
10
-
11
-
12
-
13
-
14
-
15
-
16
-
17
-
18
-
19
-
20
-
21
-
22
-
23
-
24
-
25
-
26
-
27
-
28
-
29
-
30
-
31
-
32
-
 33
33 -
 34
34 -
 35
35 -
 36
36 -
 37
37 -
 38
38 -
 39
39 -
 40
40 -
 41
41 -
 42
42 -
 43
43 -
 44
44 -
 45
45 -
 46
46 -
 47
47 -
 48
48 -
 49
49 -
 50
50 -
 51
51 -
 52
52 -
 53
53 -
54
-
55
-
56
-
57
-
58
-
59
-
60
-
61
-
62
-
63
-
64
-
65
-
66
-
67
-
68
-
69
-
70
-
71
-
72
-
73
-
74
-
75
-
76
-
77
-
78
-
79
-
80
-
81
-
82
-
83
-
84
-
85
-
86
-
87
-
88
-
89
-
90
-
91
-
92
-
93
-
94
-
95
-
96
-
97
-
98
-
99
-
100
-
101
-
102
-
103
-
104
-
105
-
106
-
107
-
108
-
109
-
110
-
111
-
112
-
113
-
114
-
115
-
116
-
117
-
118
-
119
-
120
-
121
-
122
-
123
-
124
-
125
-
126
-
127
-
128
-
129
-
130
-
131
-
132
-
133
-
134
 |
 |

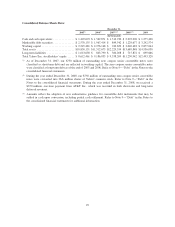
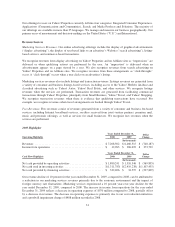
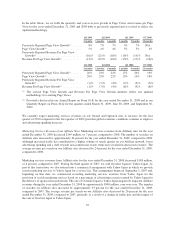
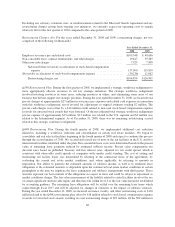
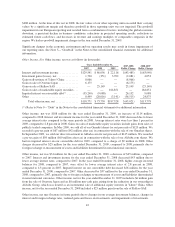
In the table below, we set forth the quarterly and year-over-year growth in Page Views and revenue per Page
View for the years ended December 31, 2009 and 2008 both as previously reported and as revised to reflect our
updated methodology.
Q1 2009 Q2 2009 Q3 2009 FY 2009
3 months 3 months 6 months 3 months 9 months 12 months
Previously Reported Page View Growth(2) ....... 8% 7% 7% 5% 7% N/A
Page View Growth(1) ........................ 5% 4% 4% 5% 5% 4%
Previously Reported Revenue Per Page View
Growth(2) ............................... (16)% (21)% (18)% (19)% (19)% N/A
Revenue Per Page View Growth(1) ............. (13)% (19)% (16)% (19)% (17)% (16)%
Q1 2008 Q2 2008 Q3 2008 FY 2008
3 months 3 months 6 months 3 months 9 months 12 months
Previously Reported Page View Growth(2) ....... 20% 23% 22% 17% 20% 19%
Page View Growth(1) ........................ 20% 23% 22% 15% 19% 18%
Previously Reported Revenue Per Page View
Growth(2) ............................... (1)% (7)% (4)% (7)% (5)% (7)%
Revenue Per Page View Growth(1) ............. (1)% (7)% (4)% (6)% (5)% (6)%
(1) The revised Page View Growth and Revenue Per Page View Growth numbers reflect our updated
methodology for counting Page Views.
(2) Previously disclosed in our Annual Report on Form 10-K for the year ended December 31, 2008 and in our
Quarterly Report on Form 10-Q for the quarters ended March 31, 2009, June 30, 2009, and September 30,
2009.
We currently expect marketing services revenues on our Owned and Operated sites to increase for the first
quarter of 2010 compared to the first quarter of 2009 provided global economic conditions continue to improve
and advertising spending increases.
Marketing Services Revenues from Affiliate Sites. Marketing services revenues from Affiliate sites for the year
ended December 31, 2009 decreased $149 million, or 7 percent, compared to 2008. The number of searches on
Affiliate sites increased by approximately 24 percent for the year ended December 31, 2009, compared to 2008.
Although increased traffic has contributed to a higher volume of search queries on our Affiliate network, lower
advertising spending and a shift towards non-commercial search terms have resulted in decreased revenues. The
average revenue per search on our Affiliate sites decreased by 24 percent for the year ended December 31, 2009,
compared to 2008.
Marketing services revenues from Affiliate sites for the year ended December 31, 2008 decreased $148 million,
or 6 percent, compared to 2007. During the third quarter of 2007, we sold Overture Japan to Yahoo Japan. As
part of this transaction, we also entered into a commercial arrangement with Yahoo Japan in which we provide
search marketing services to Yahoo Japan for a service fee. This arrangement began on September 1, 2007 and,
beginning on that date, we commenced recording marketing services revenues from Yahoo Japan for the
provision of search marketing services based on a percentage of advertising revenues earned by Yahoo Japan for
the delivery of sponsored search results. The sale of Overture Japan to Yahoo Japan negatively impacted Affiliate
revenues during the year ended December 31, 2008 by approximately $300 million, year-over-year. The number
of searches on Affiliate sites increased by approximately 23 percent for the year ended December 31, 2008,
compared to 2007. The average revenue per search on our Affiliate sites decreased by 26 percent for the year
ended December 31, 2008, compared to 2007, primarily as a result of a change in traffic mix and the impact of
the sale of Overture Japan to Yahoo Japan.
35