Yahoo 2009 Annual Report Download - page 34
Download and view the complete annual report
Please find page 34 of the 2009 Yahoo annual report below. You can navigate through the pages in the report by either clicking on the pages listed below, or by using the keyword search tool below to find specific information within the annual report.-
 1
1 -
2
-
3
-
4
-
5
-
6
-
7
-
8
-
9
-
10
-
11
-
12
-
13
-
14
-
15
-
16
-
17
-
18
-
19
-
20
-
21
-
22
-
23
-
 24
24 -
 25
25 -
 26
26 -
 27
27 -
 28
28 -
 29
29 -
 30
30 -
 31
31 -
 32
32 -
 33
33 -
 34
34 -
 35
35 -
 36
36 -
 37
37 -
 38
38 -
 39
39 -
 40
40 -
 41
41 -
 42
42 -
 43
43 -
 44
44 -
45
-
46
-
47
-
48
-
49
-
50
-
51
-
52
-
53
-
54
-
55
-
56
-
57
-
58
-
59
-
60
-
61
-
62
-
63
-
64
-
65
-
66
-
67
-
68
-
69
-
70
-
71
-
72
-
73
-
74
-
75
-
76
-
77
-
78
-
79
-
80
-
81
-
82
-
83
-
84
-
85
-
86
-
87
-
88
-
89
-
90
-
91
-
92
-
93
-
94
-
95
-
96
-
97
-
98
-
99
-
100
-
101
-
102
-
103
-
104
-
105
-
106
-
107
-
108
-
109
-
110
-
111
-
112
-
113
-
114
-
115
-
116
-
117
-
118
-
119
-
120
-
121
-
122
-
123
-
124
-
125
-
126
-
127
-
128
-
129
-
130
-
131
-
132
-
133
-
134
 |
 |

Part II
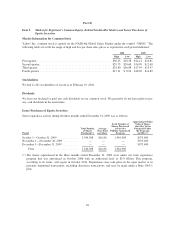
Item 5. Market for Registrant’s Common Equity, Related Stockholder Matters and Issuer Purchases of
Equity Securities
Market Information for Common Stock
Yahoo! Inc. common stock is quoted on the NASDAQ Global Select Market under the symbol “YHOO.” The
following table sets forth the range of high and low per share sales prices as reported for each period indicated:
2008 2009
High Low High Low
First quarter ................................................... $30.25 $18.58 $14.14 $10.81
Second quarter ................................................. $29.73 $20.60 $16.99 $12.60
Third quarter .................................................. $24.80 $16.88 $17.94 $13.97
Fourth quarter ................................................. $17.31 $ 8.94 $18.02 $14.80
Stockholders
We had 11,201 stockholders of record as of February 19, 2010.
Dividends
We have not declared or paid any cash dividends on our common stock. We presently do not have plans to pay
any cash dividends in the near future.
Issuer Purchases of Equity Securities
Stock repurchase activity during the three months ended December 31, 2009 was as follows:
Period
Total Number
of Shares
Purchased(*)
Average
Price Paid
per Share
Total Number of
Shares Purchased
as Part of a
Publicly Announced
Program
Approximate Dollar
Value of Shares
that May Yet be
Purchased Under
the Programs
(in 000s)(*)
October 1—October 31, 2009 .............. 1,344,308 $16.86 1,344,308 $973,400
November 1—November 30, 2009 .......... — — — $973,400
December 1—December 31, 2009 ........... — — — $973,400
Total .............................. 1,344,308 $16.86 1,344,308
(*) The shares repurchased in the three months ended December 31, 2009 were under our stock repurchase
program that was announced in October 2006 with an authorized level of $3.0 billion. This program,
according to its terms, will expire in October 2011. Repurchases may take place in the open market or in
privately negotiated transactions, including derivative transactions, and may be made under a Rule 10b5-1
plan.
26