Yahoo 2009 Annual Report Download - page 95
Download and view the complete annual report
Please find page 95 of the 2009 Yahoo annual report below. You can navigate through the pages in the report by either clicking on the pages listed below, or by using the keyword search tool below to find specific information within the annual report.-
 1
1 -
2
-
3
-
4
-
5
-
6
-
7
-
8
-
9
-
10
-
11
-
12
-
13
-
14
-
15
-
16
-
17
-
18
-
19
-
20
-
21
-
22
-
23
-
24
-
25
-
26
-
27
-
28
-
29
-
30
-
31
-
32
-
33
-
34
-
35
-
36
-
37
-
38
-
39
-
40
-
41
-
42
-
43
-
44
-
45
-
46
-
47
-
48
-
49
-
50
-
51
-
52
-
53
-
54
-
55
-
56
-
57
-
58
-
59
-
60
-
61
-
62
-
63
-
64
-
65
-
66
-
67
-
68
-
69
-
70
-
71
-
72
-
73
-
74
-
75
-
76
-
77
-
78
-
79
-
80
-
81
-
82
-
83
-
84
-
 85
85 -
 86
86 -
 87
87 -
 88
88 -
 89
89 -
 90
90 -
 91
91 -
 92
92 -
 93
93 -
 94
94 -
 95
95 -
 96
96 -
 97
97 -
 98
98 -
 99
99 -
 100
100 -
 101
101 -
 102
102 -
 103
103 -
 104
104 -
 105
105 -
106
-
107
-
108
-
109
-
110
-
111
-
112
-
113
-
114
-
115
-
116
-
117
-
118
-
119
-
120
-
121
-
122
-
123
-
124
-
125
-
126
-
127
-
128
-
129
-
130
-
131
-
132
-
133
-
134
 |
 |

Yahoo! Inc.
Notes to Consolidated Financial Statements—(Continued)
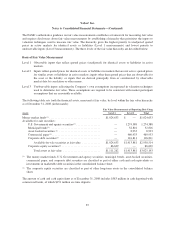
The FASB’s authoritative guidance on fair value measurements establishes a framework for measuring fair value
and requires disclosures about fair value measurements by establishing a hierarchy that prioritizes the inputs to
valuation techniques used to measure fair value. The hierarchy gives the highest priority to unadjusted quoted
prices in active markets for identical assets or liabilities (Level 1 measurements) and lowest priority to
unobservable inputs (Level 3 measurements). The three levels of the fair value hierarchy are described below:
Basis of Fair Value Measurement
Level 1 Observable inputs that reflect quoted prices (unadjusted) for identical assets or liabilities in active
markets.
Level 2 Inputs reflect quoted prices for identical assets or liabilities in markets that are not active; quoted prices
for similar assets or liabilities in active markets; inputs other than quoted prices that are observable for
the asset or the liability; or inputs that are derived principally from or corroborated by observable
market data by correlation or other means.
Level 3 Unobservable inputs reflecting the Company’s own assumptions incorporated in valuation techniques
used to determine fair value. These assumptions are required to be consistent with market participant
assumptions that are reasonably available.
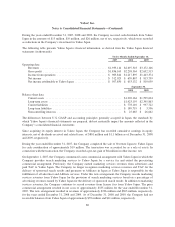
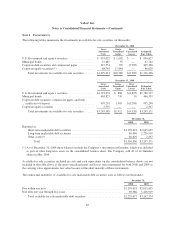
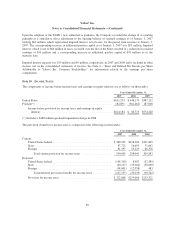
The following table sets forth the financial assets, measured at fair value, by level within the fair value hierarchy
as of December 31, 2008 (in thousands):
Fair Value Measurements at Reporting Date Using
Assets Level 1 Level 2 Total
Money market funds(1) .................................... $1,024,633 $ — $1,024,633
Available-for-sale securities:
U.S. Government and agency securities(1) ................. — 1,274,388 1,274,388
Municipal bonds(1) .................................. — 52,816 52,816
Asset-backed securities (1) ............................. — 8,933 8,933
Commercial paper(1) .................................. — 460,933 460,933
Corporate debt securities(1) ............................ — 116,811 116,811
Available-for-sale securities at fair value ............. $1,024,633 $1,913,881 $2,938,514
Corporate equity securities(2) ........................... 86,629 — 86,629
Total assets at fair value .......................... $1,111,262 $1,913,881 $3,025,143
(1) The money market funds, U.S. Government and agency securities, municipal bonds, asset-backed securities,
commercial paper, and corporate debt securities are classified as part of either cash and cash equivalents or
investments in marketable debt securities in the consolidated balance sheet.
(2) The corporate equity securities are classified as part of other long-term assets in the consolidated balance
sheet.
The amount of cash and cash equivalents as of December 31, 2008 includes $583 million in cash deposited with
commercial banks, of which $151 million are time deposits.
87