Yahoo 2009 Annual Report Download - page 50
Download and view the complete annual report
Please find page 50 of the 2009 Yahoo annual report below. You can navigate through the pages in the report by either clicking on the pages listed below, or by using the keyword search tool below to find specific information within the annual report.-
 1
1 -
2
-
3
-
4
-
5
-
6
-
7
-
8
-
9
-
10
-
11
-
12
-
13
-
14
-
15
-
16
-
17
-
18
-
19
-
20
-
21
-
22
-
23
-
24
-
25
-
26
-
27
-
28
-
29
-
30
-
31
-
32
-
33
-
34
-
35
-
36
-
37
-
38
-
39
-
 40
40 -
 41
41 -
 42
42 -
 43
43 -
 44
44 -
 45
45 -
 46
46 -
 47
47 -
 48
48 -
 49
49 -
 50
50 -
 51
51 -
 52
52 -
 53
53 -
 54
54 -
 55
55 -
 56
56 -
 57
57 -
 58
58 -
 59
59 -
 60
60 -
61
-
62
-
63
-
64
-
65
-
66
-
67
-
68
-
69
-
70
-
71
-
72
-
73
-
74
-
75
-
76
-
77
-
78
-
79
-
80
-
81
-
82
-
83
-
84
-
85
-
86
-
87
-
88
-
89
-
90
-
91
-
92
-
93
-
94
-
95
-
96
-
97
-
98
-
99
-
100
-
101
-
102
-
103
-
104
-
105
-
106
-
107
-
108
-
109
-
110
-
111
-
112
-
113
-
114
-
115
-
116
-
117
-
118
-
119
-
120
-
121
-
122
-
123
-
124
-
125
-
126
-
127
-
128
-
129
-
130
-
131
-
132
-
133
-
134
 |
 |

$488 million. At the time of this test in 2008, the fair values of our other reporting units exceeded their carrying
values by a significant margin and therefore goodwill in those reporting units was not impaired. The goodwill
impairment in our European reporting unit resulted from a combination of factors, including the global economic
downturn, a persistent decline in business conditions, reductions in projected operating results, reductions in
estimated future cash flows, and decreases in revenue and earnings multiples of comparable companies in the
region. We had no goodwill impairment charges in the year ended December 31, 2009.
Significant changes in the economic environment and our operating results may result in future impairment of
our reporting units. See Note 5—“Goodwill” in the Notes to the consolidated financial statements for additional
information.
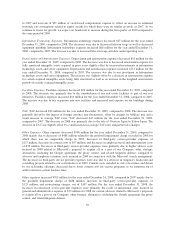
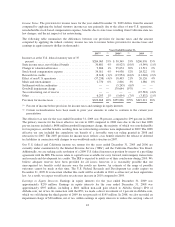
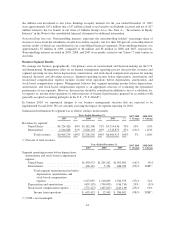
Other Income, Net. Other income, net was as follows (in thousands):
Years Ended December 31, 2007-2008
Dollar Change
2008-2009
Dollar Change2007 2008 2009
Interest and investment income ............. $129,541 $ 86,056 $ 22,116 $(43,485) $ (63,940)
Investment gains (losses), net ............... 1,730 (351) 3,702 (2,081) 4,053
Gain on divestiture of Yahoo! China ......... 8,066 — — (8,066) —
Gain on sale of Overture Japan .............. 6,175 — — (6,175) —
Gain on sale of Kelkoo SAS ................ — 25,149 — 25,149 (25,149)
Gain on sales of marketable equity securities . . . — — 164,851 — 164,851
Imputed interest on convertible debt(*) ........ (35,240) (9,088) — 26,152 9,088
Other .................................. 8,499 (28,016) (3,141) (36,515) 24,875
Total other income, net ................ $118,771 $ 73,750 $187,528 $(45,021) $113,778
(*) Refer to Note 9—“Debt” in the Notes to the consolidated financial statements for additional information.
Other income, net was $188 million for the year ended December 31, 2009, an increase of $114 million,
compared to 2008. Interest and investment income for the year ended December 31, 2009 decreased due to lower
average interest rates compared to the same periods in 2008. Average interest rates were less than 1 percent in
2009, compared to 2.8 percent in 2008. Gains on sales of marketable equity securities include gains from sales of
publicly traded companies. In May 2009, we sold all of our Gmarket shares for net proceeds of $120 million. We
recorded a pre-tax gain of $67 million ($42 million after tax) in connection with the sale of our Gmarket shares.
In September 2009, we sold our direct investment in Alibaba.com for net proceeds of $145 million. We recorded
a pre-tax gain of $98 million ($60 million after tax) in connection with the sale of our Alibaba.com shares. We
had no imputed interest on our convertible debt in 2009, compared to a charge of $9 million in 2008. Other
charges decreased by $25 million for the year ended December 31, 2009, compared to 2008, primarily due to
foreign exchange re-measurement of assets and liabilities denominated in non-functional currencies.
Other income, net was $74 million for the year ended December 31, 2008, a decrease of $45 million, compared
to 2007. Interest and investment income for the year ended December 31, 2008 decreased $43 million due to
lower average interest rates, compared to 2007. In the year ended December 31, 2008, higher average invested
balances for 2008, compared to 2007, were offset by lower average interest rates of 2.8 percent in 2008,
compared to 4.3 percent in 2007. Imputed interest on our convertible debt decreased $26 million for the year
ended December 31, 2008, compared to 2007. Other decreased by $37 million for the year ended December 31,
2008, compared to 2007, primarily due to foreign exchange re-measurement of assets and liabilities denominated
in non-functional currencies. Other income, net for the year ended December 31, 2007 included a $6 million gain
from the sale of Overture Japan and an $8 million non-cash gain arising from the reduction in our ownership in
Alibaba Group, which was treated as an incremental sale of additional equity interests in Yahoo! China. Other
income, net for the year ended December 31, 2008 included a $25 million gain from the sale of Kelkoo SAS.
Other income, net may fluctuate in future periods due to changes in our average investment balances, changes in
interest and foreign exchange rates, realized gains and losses on investments, and impairments of investments.
42