Yahoo 2009 Annual Report Download - page 47
Download and view the complete annual report
Please find page 47 of the 2009 Yahoo annual report below. You can navigate through the pages in the report by either clicking on the pages listed below, or by using the keyword search tool below to find specific information within the annual report.-
 1
1 -
2
-
3
-
4
-
5
-
6
-
7
-
8
-
9
-
10
-
11
-
12
-
13
-
14
-
15
-
16
-
17
-
18
-
19
-
20
-
21
-
22
-
23
-
24
-
25
-
26
-
27
-
28
-
29
-
30
-
31
-
32
-
33
-
34
-
35
-
36
-
 37
37 -
 38
38 -
 39
39 -
 40
40 -
 41
41 -
 42
42 -
 43
43 -
 44
44 -
 45
45 -
 46
46 -
 47
47 -
 48
48 -
 49
49 -
 50
50 -
 51
51 -
 52
52 -
 53
53 -
 54
54 -
 55
55 -
 56
56 -
 57
57 -
58
-
59
-
60
-
61
-
62
-
63
-
64
-
65
-
66
-
67
-
68
-
69
-
70
-
71
-
72
-
73
-
74
-
75
-
76
-
77
-
78
-
79
-
80
-
81
-
82
-
83
-
84
-
85
-
86
-
87
-
88
-
89
-
90
-
91
-
92
-
93
-
94
-
95
-
96
-
97
-
98
-
99
-
100
-
101
-
102
-
103
-
104
-
105
-
106
-
107
-
108
-
109
-
110
-
111
-
112
-
113
-
114
-
115
-
116
-
117
-
118
-
119
-
120
-
121
-
122
-
123
-
124
-
125
-
126
-
127
-
128
-
129
-
130
-
131
-
132
-
133
-
134
 |
 |
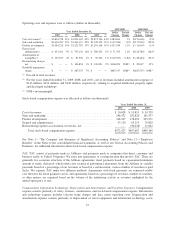
to 2007 and reversals of $51 million of stock-based compensation expense to reflect an increase in estimated
forfeiture rate assumptions related to equity awards for which there were no similar reversals in 2007. As we
continue to invest for growth, we expect our headcount to increase during the first quarter of 2010 compared to
the same period of 2009.
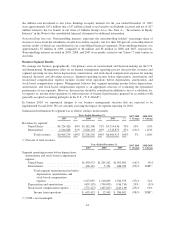
Information Technology Expenses. Information technology expenses decreased $27 million for the year ended
December 31, 2009, compared to 2008. The decreases were due to decreased telecom usage as well as decreased
equipment spending. Information technology expenses increased $66 million for the year ended December 31,
2008, compared to 2007. The increase was due to increased telecom usage and data center operating costs.
Depreciation and Amortization Expenses. Depreciation and amortization expenses decreased $51 million for the
year ended December 31, 2009, compared to 2008. The decrease was due to decreased amortization expense for
fully amortized intangible assets acquired in prior years slightly offset by increased investments in information
technology assets and server equipment. Depreciation and amortization expenses increased $131 million for the
year ended December 31, 2008, compared to 2007. The increase was due to our investment in information
technology assets and server equipment. The increase was slightly offset by a decrease in amortization expense
for certain acquired intangible assets being fully amortized as well as an increase in the weighted amortization
periods of recently acquired intangible assets.
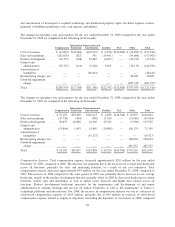
Facilities Expenses. Facilities expenses decreased $23 million for the year ended December 31, 2009, compared
to 2008. The decrease was primarily due to the consolidation of our real estate facilities as part of our cost
initiatives. Facilities expenses increased $14 million for the year ended December 31, 2008, compared to 2007.
The increase was due to our expansion into new facilities and increased rent expense on our buildings during
2008.
TAC. TAC decreased $32 million for the year ended December 31, 2009, compared to 2008. The decrease was
primarily driven by the impact of foreign currency rate fluctuations, offset by changes in Affiliate mix and a
small increase in average TAC rates. TAC decreased $47 million for the year ended December 31, 2008,
compared to 2007. The decrease in 2008 was primarily due to the sale of Overture Japan to Yahoo Japan. The
decrease in TAC was slightly offset by a small increase in average TAC rates and partner mix changes.
Other Expenses. Other expenses decreased $708 million for the year ended December 31, 2009, compared to
2008 mainly due to decreases of $488 million related to the goodwill impairment charge recorded in 2008 for
which there was no comparable charge in 2009, decreases in third-party service-provider expenses of
$117 million, decreases in content costs of $57 million, and decreases in employee travel and entertainment costs
of $39 million. Decreases in third-party service-provider expenses were primarily due to higher advisor costs
incurred in 2008 related to Microsoft’s proposal to acquire all or a part of our Company, other strategic
alternatives, including the Google agreement, the proxy contest, and related litigation defense, compared to
advisory and employee retention costs incurred in 2009 in connection with the Microsoft search arrangement.
The decreases in third-party service provider expenses were also due to a decrease in temporary headcount and
consulting projects related to our cost initiatives in 2009. Content costs, included in costs of revenues and driven
by our rich media offerings, decreased due to lower content costs for various properties as we transition out of
and/or outsource certain business lines.
Other expenses increased $703 million for the year ended December 31, 2008, compared to 2007 mainly due to
the goodwill impairment charge of $488 million, increases in third-party service-provider expenses of
$125 million, and restructuring charges, net of $107 million. For the year ended December 31, 2008, the
increases in outsourced service-provider expenses were primarily the result of incremental costs incurred in
general and administrative expense of $79 million for 2008 for outside advisors related to Microsoft’s proposals
to acquire all or a part of our Company, other strategic alternatives, including the Google agreement, the proxy
contest, and related litigation defense.
39