Yahoo 2009 Annual Report Download - page 42
Download and view the complete annual report
Please find page 42 of the 2009 Yahoo annual report below. You can navigate through the pages in the report by either clicking on the pages listed below, or by using the keyword search tool below to find specific information within the annual report.-
 1
1 -
2
-
3
-
4
-
5
-
6
-
7
-
8
-
9
-
10
-
11
-
12
-
13
-
14
-
15
-
16
-
17
-
18
-
19
-
20
-
21
-
22
-
23
-
24
-
25
-
26
-
27
-
28
-
29
-
30
-
31
-
 32
32 -
 33
33 -
 34
34 -
 35
35 -
 36
36 -
 37
37 -
 38
38 -
 39
39 -
 40
40 -
 41
41 -
 42
42 -
 43
43 -
 44
44 -
 45
45 -
 46
46 -
 47
47 -
 48
48 -
 49
49 -
 50
50 -
 51
51 -
 52
52 -
53
-
54
-
55
-
56
-
57
-
58
-
59
-
60
-
61
-
62
-
63
-
64
-
65
-
66
-
67
-
68
-
69
-
70
-
71
-
72
-
73
-
74
-
75
-
76
-
77
-
78
-
79
-
80
-
81
-
82
-
83
-
84
-
85
-
86
-
87
-
88
-
89
-
90
-
91
-
92
-
93
-
94
-
95
-
96
-
97
-
98
-
99
-
100
-
101
-
102
-
103
-
104
-
105
-
106
-
107
-
108
-
109
-
110
-
111
-
112
-
113
-
114
-
115
-
116
-
117
-
118
-
119
-
120
-
121
-
122
-
123
-
124
-
125
-
126
-
127
-
128
-
129
-
130
-
131
-
132
-
133
-
134
 |
 |
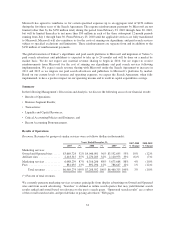
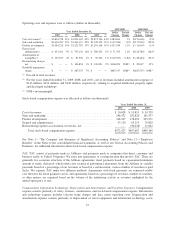
We also receive revenues for Content Match links (advertising in the form of contextually relevant links to
advertisers’ Websites) on Owned and Operated and Affiliate sites and display advertising on Affiliate sites. The
net revenues and related volume metrics from these additional sources are not currently material and are
excluded from the discussion and calculation of average revenue per Page View on Owned and Operated sites
and average revenue per search on Affiliate sites that follows.
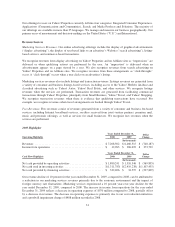
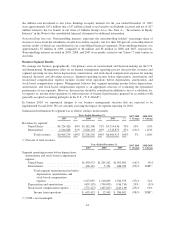
Marketing Services Revenues from Owned and Operated Sites. Marketing services revenues from Owned and
Operated sites for the year ended December 31, 2009 decreased by approximately $493 million, or 12 percent,
compared to 2008. For the year ended December 31, 2009, revenues from search advertising and display
advertising on Owned and Operated sites declined 13 percent and 9 percent, respectively, compared to 2008.
Although increased user activity levels on Yahoo! Properties has contributed to a higher volume of search
queries and Page Views, lower advertising spending in both search and display advertising due to the economic
environment during the majority of 2009 and a shift towards lower yielding inventory and non-commercial
search terms have resulted in decreased revenues. In addition, the sale of Kelkoo SAS during the year ended
December 31, 2008 contributed to the decline in revenues year-over-year. During 2009, the effects of foreign
currency exchange rate fluctuations also contributed to the decline in revenues, compared to 2008. Using the
foreign currency exchange rates from 2008, revenues from our Owned and Operated sites for 2009 would have
been higher than we reported by approximately $71 million.
Marketing services revenues from Owned and Operated sites for the year ended December 31, 2008 increased by
approximately $376 million, or 10 percent, compared to 2007. Factors leading to growth in overall marketing
services revenues from 2007 to 2008 included an increase in user activity levels on Yahoo! Properties, which
contributed to a higher volume of search queries, Page Views, and ad impression displays. The transition of and
changes in certain of our broadband access partnerships from being fee-paying user based to an advertising
revenue sharing model also contributed to the increase in marketing services revenues from Owned and Operated
sites. For the year ended December 31, 2008, revenues from search advertising on Owned and Operated sites
grew 17 percent, compared to 2007. For the year ended December 31, 2008, revenues from display advertising
on Owned and Operated sites grew 7 percent, compared to 2007.
We periodically review and refine our methodology for monitoring, gathering, and counting Page Views to more
accurately reflect the total number of Web pages viewed by users on Yahoo! Properties. Based on this process,
from time to time, we update our methodology to exclude from the count of Page Views interactions with our
servers that we determine or believe are not the result of user visits to our Owned and Operated sites.
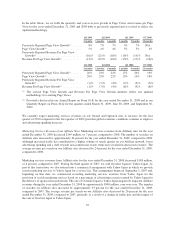
For the year ended December 31, 2009, Page Views increased 4 percent and revenue per Page View decreased 16
percent, compared to 2008. The decline in revenue per Page View in 2009 compared to 2008 was due to the
decline in revenues as discussed above. For the year ended December 31, 2008, Page Views increased 18 percent
and revenue per Page View decreased 6 percent compared to 2007. The decrease in revenue per Page View in
2008 compared to 2007 was due to a shift to lower-yielding display advertising.
34