Yahoo 2009 Annual Report Download - page 52
Download and view the complete annual report
Please find page 52 of the 2009 Yahoo annual report below. You can navigate through the pages in the report by either clicking on the pages listed below, or by using the keyword search tool below to find specific information within the annual report.-
 1
1 -
2
-
3
-
4
-
5
-
6
-
7
-
8
-
9
-
10
-
11
-
12
-
13
-
14
-
15
-
16
-
17
-
18
-
19
-
20
-
21
-
22
-
23
-
24
-
25
-
26
-
27
-
28
-
29
-
30
-
31
-
32
-
33
-
34
-
35
-
36
-
37
-
38
-
39
-
40
-
41
-
 42
42 -
 43
43 -
 44
44 -
 45
45 -
 46
46 -
 47
47 -
 48
48 -
 49
49 -
 50
50 -
 51
51 -
 52
52 -
 53
53 -
 54
54 -
 55
55 -
 56
56 -
 57
57 -
 58
58 -
 59
59 -
 60
60 -
 61
61 -
 62
62 -
63
-
64
-
65
-
66
-
67
-
68
-
69
-
70
-
71
-
72
-
73
-
74
-
75
-
76
-
77
-
78
-
79
-
80
-
81
-
82
-
83
-
84
-
85
-
86
-
87
-
88
-
89
-
90
-
91
-
92
-
93
-
94
-
95
-
96
-
97
-
98
-
99
-
100
-
101
-
102
-
103
-
104
-
105
-
106
-
107
-
108
-
109
-
110
-
111
-
112
-
113
-
114
-
115
-
116
-
117
-
118
-
119
-
120
-
121
-
122
-
123
-
124
-
125
-
126
-
127
-
128
-
129
-
130
-
131
-
132
-
133
-
134
 |
 |

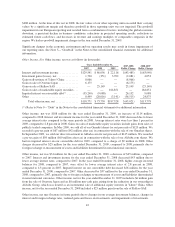
the Alibaba.com investment to fair value. Earnings in equity interests for the year ended December 31, 2007
were approximately $151 million (net of $7 million related to tax benefits on dividends received and net of $17
million related to the tax benefit of our share of Alibaba Group’s loss). See Note 4— “Investments in Equity
Interests” in the Notes to the consolidated financial statements for additional information.
Noncontrolling Interests. Noncontrolling interests represents the noncontrolling holders’ percentage share of
income or losses from the subsidiaries in which we hold a majority, but less than 100 percent, ownership interest
and the results of which are consolidated in our consolidated financial statements. Noncontrolling interests was
approximately $7 million in 2009, compared to $6 million and $3 million in 2008 and 2007, respectively.
Noncontrolling interests recorded in 2009, 2008, and 2007 were mainly related to our Yahoo! 7 joint venture in
Australia.
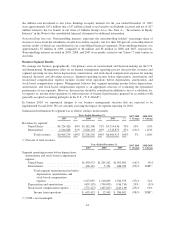
Business Segment Results
We manage our business geographically. Our primary areas of measurement and decision-making are the U.S.
and International. Management relies on an internal management reporting process that provides revenues and
segment operating income before depreciation, amortization, and stock-based compensation expense for making
financial decisions and allocating resources. Segment operating income before depreciation, amortization, and
stock-based compensation expense includes income from operations before depreciation, amortization, and
stock-based compensation expense. Management believes that segment operating income before depreciation,
amortization, and stock-based compensation expense is an appropriate measure of evaluating the operational
performance of our segments. However, this measure should be considered in addition to, not as a substitute for,
or superior to, income from operations or other measures of financial performance prepared in accordance with
generally accepted accounting principles in the U.S. (“U.S. GAAP”).
In January 2010, we announced changes to our business management structure that are expected to be
implemented by mid 2010. We are currently assessing the impact on segment reporting for 2010.
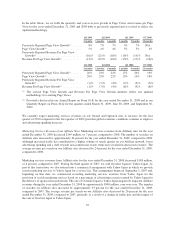
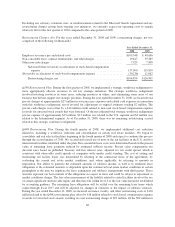
Summarized information by segment was as follows (dollars in thousands):
Years Ended December 31, 2007-2008
% Change
2008-2009
% Change2007 (*) 2008 (*) 2009 (*)
Revenues by segment:
United States ....... $4,724,426 68% $5,182,308 72% $4,714,436 73% 10% (9)%
International ........ 2,244,848 32% 2,026,194 28% 1,745,879 27% (10)% (14)%
Total revenues . . $6,969,274 100% $7,208,502 100% $6,460,315 100% 3% (10)%
(*) Percent of total revenues.
Years Ended December 31, 2007-2008
% Change
2008-2009
% Change2007 2008 2009
Segment operating income before depreciation,
amortization, and stock-based compensation
expense:
United States ........................ $1,430,923 $1,205,262 $1,095,601 (16)% (9)%
International ......................... 496,112 5,341 486,954 (99)% N/M(*)
Total segment operating income before
depreciation, amortization, and
stock-based compensation
expense ....................... 1,927,035 1,210,603 1,582,555 (37)% 31%
Depreciation and amortization ........... (659,195) (790,033) (746,714) 20% (5)%
Stock-based compensation expense ....... (572,427) (407,607) (449,149) (29)% 10%
Income from operations ............ $ 695,413 $ 12,963 $ 386,692 (98)% N/M(*)
(*) N/M = not meaningful.
44