Yahoo 2009 Annual Report Download - page 96
Download and view the complete annual report
Please find page 96 of the 2009 Yahoo annual report below. You can navigate through the pages in the report by either clicking on the pages listed below, or by using the keyword search tool below to find specific information within the annual report.-
 1
1 -
2
-
3
-
4
-
5
-
6
-
7
-
8
-
9
-
10
-
11
-
12
-
13
-
14
-
15
-
16
-
17
-
18
-
19
-
20
-
21
-
22
-
23
-
24
-
25
-
26
-
27
-
28
-
29
-
30
-
31
-
32
-
33
-
34
-
35
-
36
-
37
-
38
-
39
-
40
-
41
-
42
-
43
-
44
-
45
-
46
-
47
-
48
-
49
-
50
-
51
-
52
-
53
-
54
-
55
-
56
-
57
-
58
-
59
-
60
-
61
-
62
-
63
-
64
-
65
-
66
-
67
-
68
-
69
-
70
-
71
-
72
-
73
-
74
-
75
-
76
-
77
-
78
-
79
-
80
-
81
-
82
-
83
-
84
-
85
-
 86
86 -
 87
87 -
 88
88 -
 89
89 -
 90
90 -
 91
91 -
 92
92 -
 93
93 -
 94
94 -
 95
95 -
 96
96 -
 97
97 -
 98
98 -
 99
99 -
 100
100 -
 101
101 -
 102
102 -
 103
103 -
 104
104 -
 105
105 -
 106
106 -
107
-
108
-
109
-
110
-
111
-
112
-
113
-
114
-
115
-
116
-
117
-
118
-
119
-
120
-
121
-
122
-
123
-
124
-
125
-
126
-
127
-
128
-
129
-
130
-
131
-
132
-
133
-
134
 |
 |

Yahoo! Inc.
Notes to Consolidated Financial Statements—(Continued)
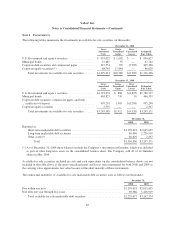
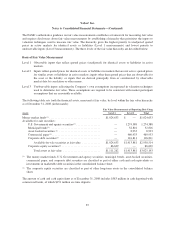
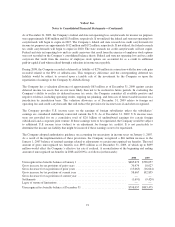
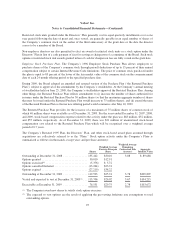
The following table sets forth the financial assets, measured at fair value, by level within the fair value hierarchy
as of December 31, 2009 (in thousands):
Fair Value Measurements at Reporting Date Using
Assets Level 1 Level 2 Total
Money market funds(1) ................................... $364,602 $ — $ 364,602
Available-for-sale securities:
U.S. Government and agency securities(1) ............... — 1,938,608 1,938,608
Municipal bonds(1) ................................. — 470,031 470,031
Commercial paper and bank certificates of deposit(1) ....... — 445,786 445,786
Corporate debt securities(1) ........................... — 641,104 641,104
Available-for-sale securities at fair value ............ $364,602 $3,495,529 $3,860,131
Corporate equity securities(2) ......................... 2,597 — 2,597
Total assets at fair value ......................... $367,199 $3,495,529 $3,862,728
(1) The money market funds, U.S. Government and agency securities, municipal bonds, commercial paper and
bank certificates of deposit, and corporate debt securities are classified as part of either cash and cash
equivalents or investments in marketable debt securities in the consolidated balance sheet.
(2) The corporate equity securities are classified as part of the other long-term assets in the consolidated balance
sheet.
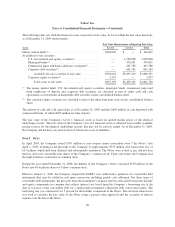
The amount of cash and cash equivalents as of December 31, 2009 includes $658 million in cash deposited with
commercial banks, of which $205 million are time deposits.
The fair value of the Company’s Level 1 financial assets is based on quoted market prices of the identical
underlying security. The fair value of the Company’s Level 2 financial assets is obtained from readily-available
pricing sources for the identical underlying security that may not be actively traded. As of December 31, 2009,
the Company did not have any material Level 3 financial assets or liabilities.
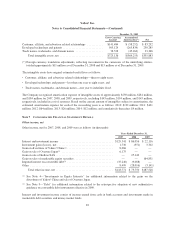
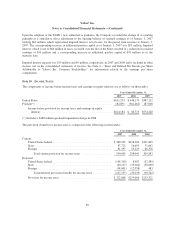
Note 9 D
EBT
In April 2003, the Company issued $750 million of zero coupon senior convertible notes (“the Notes”) due
April 1, 2008, resulting in net proceeds to the Company of approximately $733 million after transaction fees of
$17 million, which had been deferred and subsequently amortized. The Notes were issued at par, did not bear
interest, and were convertible into shares of the Company’s common stock. Upon conversion, the Company had
the right to deliver cash in lieu of common stock.
During the year ended December 31, 2008, the holders of the Company’s Notes converted $750 million of the
Notes into 36.6 million shares of Yahoo! common stock.
Effective January 1, 2009, the Company adopted the FASB’s new authoritative guidance for convertible debt
instruments that may be settled in cash upon conversion, including partial cash settlement. For these types of
convertible debt instruments, the proceeds from the instrument’s issuance must be allocated between the liability
and equity components in a manner that reflects interest cost based upon the Company’s borrowing rate at the
date of issuance of the convertible debt for a similar debt instrument without the debt conversion feature. The
borrowing rate was estimated to be 5 percent for the liability component of the Notes. This effective interest rate
was used to calculate the fair value of the Notes using a present value approach and the accretion of interest
expense over the life of the Notes.
88