Yahoo 2009 Annual Report Download - page 98
Download and view the complete annual report
Please find page 98 of the 2009 Yahoo annual report below. You can navigate through the pages in the report by either clicking on the pages listed below, or by using the keyword search tool below to find specific information within the annual report.-
 1
1 -
2
-
3
-
4
-
5
-
6
-
7
-
8
-
9
-
10
-
11
-
12
-
13
-
14
-
15
-
16
-
17
-
18
-
19
-
20
-
21
-
22
-
23
-
24
-
25
-
26
-
27
-
28
-
29
-
30
-
31
-
32
-
33
-
34
-
35
-
36
-
37
-
38
-
39
-
40
-
41
-
42
-
43
-
44
-
45
-
46
-
47
-
48
-
49
-
50
-
51
-
52
-
53
-
54
-
55
-
56
-
57
-
58
-
59
-
60
-
61
-
62
-
63
-
64
-
65
-
66
-
67
-
68
-
69
-
70
-
71
-
72
-
73
-
74
-
75
-
76
-
77
-
78
-
79
-
80
-
81
-
82
-
83
-
84
-
85
-
86
-
87
-
 88
88 -
 89
89 -
 90
90 -
 91
91 -
 92
92 -
 93
93 -
 94
94 -
 95
95 -
 96
96 -
 97
97 -
 98
98 -
 99
99 -
 100
100 -
 101
101 -
 102
102 -
 103
103 -
 104
104 -
 105
105 -
 106
106 -
 107
107 -
 108
108 -
109
-
110
-
111
-
112
-
113
-
114
-
115
-
116
-
117
-
118
-
119
-
120
-
121
-
122
-
123
-
124
-
125
-
126
-
127
-
128
-
129
-
130
-
131
-
132
-
133
-
134
 |
 |

Yahoo! Inc.
Notes to Consolidated Financial Statements—(Continued)
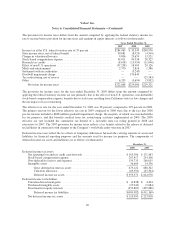
The provision for income taxes differs from the amount computed by applying the federal statutory income tax
rate to income before provision for income taxes and earnings in equity interests as follows (in thousands):
Years Ended December 31,
2007 2008 2009
Income tax at the U.S. federal statutory rate of 35 percent ................ $284,963 $ 30,349 $200,976
State income taxes, net of federal benefit ............................. 30,881 (8,925) (4,549)
Change in valuation allowance ..................................... 9,806 25,674 13,521
Stock-based compensation expense .................................. 34,011 44,938 28,322
Research tax credits .............................................. (8,618) (13,954) (11,046)
Effect of non-U.S. operations ....................................... (37,238) 18,403 20,126
Meals and entertainment .......................................... 2,770 2,816 1,386
Settlement with tax authorities ...................................... — (5,245) —
Goodwill impairment charge ....................................... — 170,644 —
Tax restructuring, net of reserve .................................... — — (25,583)
Other .......................................................... 6,293 (5,694) (3,832)
Provision for income taxes ..................................... $322,868 $259,006 $219,321
The provision for income taxes for the year ended December 31, 2009 differs from the amount computed by
applying the federal statutory income tax rate primarily due to the effect of non-U.S. operations, non-deductible
stock-based compensation expense, benefits due to state taxes resulting from California state tax law changes and
the net impact of tax restructuring.
The effective tax rate for the year ended December 31, 2009 was 38 percent, compared to 299 percent in 2008.
The primary reasons for the lower effective tax rate in 2009 compared to 2008 were due to the fact that 2008
pre-tax income included a $488 million goodwill impairment charge, the majority of which was non-deductible
for tax purposes, and that benefits resulted from tax restructuring activities implemented in 2009. The 2008
effective tax rate included the cumulative tax benefit of a favorable state tax ruling granted in 2008 and
retroactive to 2007. The 2007 provision for income taxes reflects a tax benefit related to the release of deferred
tax liabilities in connection with changes to the Company’s worldwide entity structure in 2007.
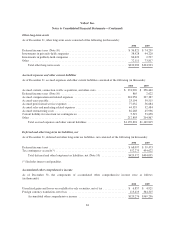
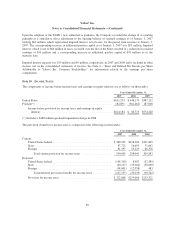
Deferred income taxes reflect the tax effects of temporary differences between the carrying amounts of assets and
liabilities for financial reporting purposes and the amounts used for income tax purposes. The components of
deferred income tax assets and liabilities are as follows (in thousands):
December 31,
2008 2009
Deferred income tax assets:
Net operating loss and tax credit carryforwards ............................. $195,306 $ 171,883
Stock-based compensation expense ...................................... 287,417 234,108
Non-deductible reserves and expenses .................................... 159,735 268,015
Intangible assets ..................................................... 36,664 14,336
Gross deferred income tax assets .................................... 679,122 688,342
Valuation allowance .............................................. (83,550) (63,364)
Deferred income tax assets ......................................... $595,572 $ 624,978
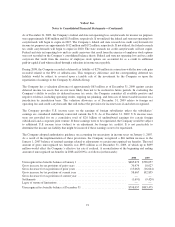
Deferred income tax liabilities:
Unrealized investment gains ............................................ $ (4,838) $ 4,404
Purchased intangible assets ............................................ (25,942) (9,684)
Investments in equity interests .......................................... (453,802) (405,880)
Deferred income tax liabilities ...................................... $(484,582) $(411,160)
Net deferred income tax assets .......................................... $110,990 $ 213,818
90