Yahoo 2009 Annual Report Download - page 39
Download and view the complete annual report
Please find page 39 of the 2009 Yahoo annual report below. You can navigate through the pages in the report by either clicking on the pages listed below, or by using the keyword search tool below to find specific information within the annual report.-
 1
1 -
2
-
3
-
4
-
5
-
6
-
7
-
8
-
9
-
10
-
11
-
12
-
13
-
14
-
15
-
16
-
17
-
18
-
19
-
20
-
21
-
22
-
23
-
24
-
25
-
26
-
27
-
28
-
 29
29 -
 30
30 -
 31
31 -
 32
32 -
 33
33 -
 34
34 -
 35
35 -
 36
36 -
 37
37 -
 38
38 -
 39
39 -
 40
40 -
 41
41 -
 42
42 -
 43
43 -
 44
44 -
 45
45 -
 46
46 -
 47
47 -
 48
48 -
 49
49 -
50
-
51
-
52
-
53
-
54
-
55
-
56
-
57
-
58
-
59
-
60
-
61
-
62
-
63
-
64
-
65
-
66
-
67
-
68
-
69
-
70
-
71
-
72
-
73
-
74
-
75
-
76
-
77
-
78
-
79
-
80
-
81
-
82
-
83
-
84
-
85
-
86
-
87
-
88
-
89
-
90
-
91
-
92
-
93
-
94
-
95
-
96
-
97
-
98
-
99
-
100
-
101
-
102
-
103
-
104
-
105
-
106
-
107
-
108
-
109
-
110
-
111
-
112
-
113
-
114
-
115
-
116
-
117
-
118
-
119
-
120
-
121
-
122
-
123
-
124
-
125
-
126
-
127
-
128
-
129
-
130
-
131
-
132
-
133
-
134
 |
 |

Our offerings to users on Yahoo! Properties currently fall into four categories: Integrated Consumer Experiences,
Applications (Communications and Communities), Search, and Media Products and Solutions. The majority of
our offerings are available in more than 25 languages. We manage and measure our business geographically. Our
primary areas of measurement and decision-making are the United States (“U.S.”) and International.
Revenue Sources
Marketing Services Revenues. Our online advertising offerings include the display of graphical advertisements
(“display advertising”), the display of text-based links to an advertiser’s Website (“search advertising”), listing-
based services, and commerce-based transactions.
We recognize revenues from display advertising on Yahoo! Properties and on Affiliate sites as “impressions” are
delivered or when qualifying actions are performed by the user. An “impression” is delivered when an
advertisement appears on a page viewed by a user. We also recognize revenues from search advertising on
Yahoo! Properties and on Affiliate sites. We recognize revenues from these arrangements as “click-throughs”
occur. A “click-through” occurs when a user clicks on an advertiser’s listing.
Marketing services revenues also include listings and transaction revenues. Listings revenues are generated from
a variety of consumer and business listings-based services, including access to the Yahoo! HotJobs database and
classified advertising such as Yahoo! Autos, Yahoo! Real Estate, and other services. We recognize listings
revenues when the services are performed. Transaction revenues are generated from facilitating commercial
transactions through Yahoo! Properties, principally from Small Business, Yahoo! Travel, and Yahoo! Shopping.
We recognize transaction revenues when there is evidence that qualifying transactions have occurred. For
example, we recognize revenues when travel arrangements are booked through Yahoo! Travel.
Fees Revenues. Fees revenues consist of revenues generated from a variety of consumer and business fee-based
services, including Internet broadband services, royalties received from joint venture partners, premium mail,
music and personals offerings, as well as services for small businesses. We recognize fees revenues when the
services are performed.
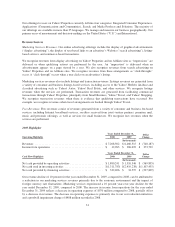
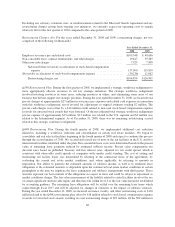
2009 Highlights
Years Ended December 31, Dollar
ChangeOperating Highlights 2008 2009
(In thousands)
Revenues ................................................ $7,208,502 $ 6,460,315 $ (748,187)
Income from operations .................................... $ 12,963 $ 386,692 $ 373,729
Years Ended December 31, Dollar
ChangeCash Flow Highlights 2008 2009
(In thousands)
Net cash provided by operating activities ....................... $1,880,241 $ 1,310,346 $ (569,895)
Net cash used in investing activities ........................... $(1,311,783) $(2,419,238) $(1,107,455)
Net cash provided by financing activities ....................... $ 332,406 $ 34,597 $ (297,809)
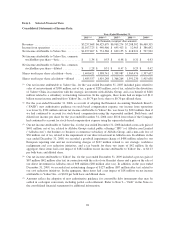
Our revenue decline of 10 percent for the year ended December 31, 2009, compared to 2008, can be attributed to
a reduction in our marketing services revenues primarily due to the economic environment and the impact of
foreign currency rate fluctuations. Marketing services experienced a 10 percent year-over-year decline for the
year ended December 31, 2009, compared to 2008. The increase in income from operations for the year ended
December 31, 2009 reflects a decrease in operating expenses of $970 million compared to 2008, partially offset
by a decrease in revenues. The decrease in operating expenses is primarily due to our cost reduction initiatives
and a goodwill impairment charge of $488 million recorded in 2008.
31