Yahoo 2009 Annual Report Download - page 77
Download and view the complete annual report
Please find page 77 of the 2009 Yahoo annual report below. You can navigate through the pages in the report by either clicking on the pages listed below, or by using the keyword search tool below to find specific information within the annual report.-
 1
1 -
2
-
3
-
4
-
5
-
6
-
7
-
8
-
9
-
10
-
11
-
12
-
13
-
14
-
15
-
16
-
17
-
18
-
19
-
20
-
21
-
22
-
23
-
24
-
25
-
26
-
27
-
28
-
29
-
30
-
31
-
32
-
33
-
34
-
35
-
36
-
37
-
38
-
39
-
40
-
41
-
42
-
43
-
44
-
45
-
46
-
47
-
48
-
49
-
50
-
51
-
52
-
53
-
54
-
55
-
56
-
57
-
58
-
59
-
60
-
61
-
62
-
63
-
64
-
65
-
66
-
 67
67 -
 68
68 -
 69
69 -
 70
70 -
 71
71 -
 72
72 -
 73
73 -
 74
74 -
 75
75 -
 76
76 -
 77
77 -
 78
78 -
 79
79 -
 80
80 -
 81
81 -
 82
82 -
 83
83 -
 84
84 -
 85
85 -
 86
86 -
 87
87 -
88
-
89
-
90
-
91
-
92
-
93
-
94
-
95
-
96
-
97
-
98
-
99
-
100
-
101
-
102
-
103
-
104
-
105
-
106
-
107
-
108
-
109
-
110
-
111
-
112
-
113
-
114
-
115
-
116
-
117
-
118
-
119
-
120
-
121
-
122
-
123
-
124
-
125
-
126
-
127
-
128
-
129
-
130
-
131
-
132
-
133
-
134
 |
 |
Yahoo! Inc.
Notes to Consolidated Financial Statements—(Continued)
weighted-average cost of capital, which reflects the overall level of inherent risk of a reporting unit and the rate
of return an outside investor would expect to earn. The cash flow projections for each reporting unit are based on
a five-year forecast of cash flows, derived from the most recent annual financial forecast, and a terminal value
based on the Perpetuity Growth Model. The sum of the fair values of the reporting units is reconciled to the
Company’s market capitalization adjusted for an estimated control premium. If the carrying value of the
reporting unit exceeds its fair value, the second step of the goodwill impairment test is performed by comparing
the carrying value of the goodwill in the reporting unit to its implied fair value. An impairment charge is
recognized for the excess of the carrying value of goodwill over its implied fair value. See Note 5—“Goodwill”
for additional information.
Intangible Assets. Intangible assets are carried at cost and amortized over their estimated useful lives, generally
on a straight-line basis over one to eight years. The Company reviews identifiable amortizable intangible assets
to be held and used for impairment whenever events or changes in circumstances indicate that the carrying value
of the assets may not be recoverable. Determination of recoverability is based on the lowest level of identifiable
estimated undiscounted cash flows resulting from use of the asset and its eventual disposition. Measurement of
any impairment loss is based on the excess of the carrying value of the asset over its fair value.
Investments in Equity Interests. Investments in the common stock of entities in which the Company can exercise
significant influence but does not own a majority equity interest or otherwise control are accounted for using the
equity method and are included as investments in equity interests on the consolidated balance sheets. The
Company records its share of the results of these companies one quarter in arrears within earnings in equity
interests on the consolidated statements of income. The Company reviews its investments for other-than-
temporary impairment whenever events or changes in business circumstances indicate that the carrying value of
the investment may not be fully recoverable. Investments identified as having an indication of impairment are
subject to further analysis to determine if the impairment is other-than-temporary and this analysis requires
estimating the fair value of the investment. The determination of fair value of the investment involves
considering factors such as the stock prices of public companies in which the Company has an equity investment,
current economic and market conditions, the operating performance of the companies including current earnings
trends and forecasted cash flows, and other company and industry specific information.
Foreign Currency. The functional currency of the Company’s international subsidiaries is evaluated on a
case-by-case basis and is often the local currency. The financial statements of these subsidiaries are translated into
U.S. dollars using period-end rates of exchange for assets and liabilities, historical rates of exchange for equity, and
average rates of exchange for the period for revenues and expenses. Translation gains (losses) are recorded in
accumulated other comprehensive income (loss) as a component of stockholders’ equity. In addition, the Company
records translation gains (losses) related to its foreign equity method investments in accumulated other
comprehensive income (loss). The Company records foreign currency transaction gains and losses, realized and
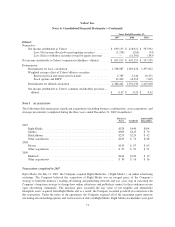
unrealized in other income, net in the consolidated statements of income. The Company recorded approximately $7
million of net gains in 2007, and $25 million and $1 million of net losses in 2008 and 2009, respectively.
Recent Accounting Pronouncements
In October 2009, the FASB amended the accounting standards for multiple deliverable revenue arrangements.
The amendment will require the arrangement consideration to be allocated based on the relative selling price for
each arrangement deliverable. The selling price for each arrangement deliverable can be established based on
vendor specific objective evidence (“VSOE”), third-party evidence (“TPE”) if VSOE is not available, or best
estimate of selling price (“BESP”) if neither VSOE nor TPE is available. The Company is in the process of
evaluating the impact of the adoption of this guidance on the Company’s consolidated financial position, cash
flows, and results of operations.
69