Yahoo 2009 Annual Report Download - page 56
Download and view the complete annual report
Please find page 56 of the 2009 Yahoo annual report below. You can navigate through the pages in the report by either clicking on the pages listed below, or by using the keyword search tool below to find specific information within the annual report.-
 1
1 -
2
-
3
-
4
-
5
-
6
-
7
-
8
-
9
-
10
-
11
-
12
-
13
-
14
-
15
-
16
-
17
-
18
-
19
-
20
-
21
-
22
-
23
-
24
-
25
-
26
-
27
-
28
-
29
-
30
-
31
-
32
-
33
-
34
-
35
-
36
-
37
-
38
-
39
-
40
-
41
-
42
-
43
-
44
-
45
-
 46
46 -
 47
47 -
 48
48 -
 49
49 -
 50
50 -
 51
51 -
 52
52 -
 53
53 -
 54
54 -
 55
55 -
 56
56 -
 57
57 -
 58
58 -
 59
59 -
 60
60 -
 61
61 -
 62
62 -
 63
63 -
 64
64 -
 65
65 -
 66
66 -
67
-
68
-
69
-
70
-
71
-
72
-
73
-
74
-
75
-
76
-
77
-
78
-
79
-
80
-
81
-
82
-
83
-
84
-
85
-
86
-
87
-
88
-
89
-
90
-
91
-
92
-
93
-
94
-
95
-
96
-
97
-
98
-
99
-
100
-
101
-
102
-
103
-
104
-
105
-
106
-
107
-
108
-
109
-
110
-
111
-
112
-
113
-
114
-
115
-
116
-
117
-
118
-
119
-
120
-
121
-
122
-
123
-
124
-
125
-
126
-
127
-
128
-
129
-
130
-
131
-
132
-
133
-
134
 |
 |
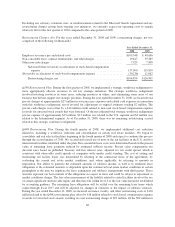
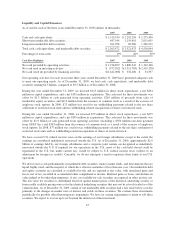
We expect to continue to generate positive cash flow from operations for the first quarter of 2010. We use cash
generated by operations as our primary source of liquidity because we believe that internally generated cash flows
are sufficient to support our business operations and capital expenditures. We believe that existing cash, cash
equivalents, and investments in marketable debt securities, together with any cash generated from operations will be
sufficient to meet normal operating requirements including capital expenditures for the next twelve months.
However, we may sell additional equity, or debt securities, or obtain credit facilities to further enhance our liquidity
position, and the sale of additional equity securities could result in dilution to our stockholders.
See Note 8—“Investments” in the Notes to the consolidated financial statements for additional information.
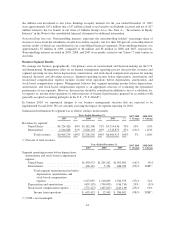
Cash flow changes
Cash provided by operating activities is driven by our net income, adjusted for non-cash items, and non-operating
gains and losses from sales of investments. Non-cash adjustments include depreciation, amortization of
intangible assets, stock-based compensation expense net of stock-based restructuring expense reversals, non-cash
restructuring charges, goodwill impairment, tax benefits from stock-based awards, and excess tax benefits from
stock-based awards. Cash provided by operating activities was greater than net income in 2009 mainly due to the
net impact of non-cash adjustments to income. In the year ended December 31, 2008, operating cash flows were
positively impacted by changes in working capital balances, including a one-time payment from AT&T Inc.
Cash used in investing activities is primarily attributable to capital expenditures, purchases, sales and maturities
of marketable debt securities, purchases of intangible assets, as well as acquisitions including our strategic
investments. Our capital expenditures totaled $434 million in 2009, $675 million in 2008, and $602 million in
2007. Our capital expenditures have been primarily used for purchases and internal development of software to
support our offerings and our increased number of users. We invested a net $195 million in acquisitions in 2009,
compared to $209 million and $974 million in 2008 and 2007, respectively. Acquisitions and investments in
2009 included the cash outlay for our acquisition of Maktoob. Acquisitions and investments in 2008 included the
cash outlay for our acquisition of Maven. Acquisitions and investments in 2007 included cash outlays for our
acquisitions of Right Media, Zimbra, and BlueLithium and an investment in Alibaba.com. In 2009 and 2008, we
utilized $2.0 billion and $368 million, respectively, for net purchases of marketable debt securities, compared to
cash proceeds from the net sales and maturities of marketable debt securities of $1.1 billion in 2007.
Cash used in financing activities is driven by employee option exercises and employee stock purchases offset by
our stock repurchases. Our cash proceeds from employee option exercises and employee stock purchases were
$113 million in 2009, compared to $363 million and $375 million in 2008 and 2007, respectively.
During 2009, we invested $113 million in the direct repurchase of 7.4 million shares of our common stock at an
average price of $15.31 per share. In addition, certain restricted stock awards that vested during 2009 were
subject to statutory tax withholding obligations. We reacquired 0.3 million shares of restricted stock awards to
satisfy the tax withholding obligations and $5 million was recorded as treasury stock. We paid $68 million
related to the net share settlement of 4.4 million shares of restricted stock units which was recorded as a
reduction of additional paid-in-capital. During 2008, we invested $79 million in the direct repurchase of
3.4 million shares of our common stock at an average price of $23.39 per share. In addition, certain restricted
stock awards that vested during 2008 were subject to statutory tax withholding obligations. We reacquired
1.1 million shares of restricted stock awards to satisfy the tax withholding obligations and $27 million was
recorded as treasury stock. We paid $50 million related to the net share settlement of 2.2 million shares of
restricted stock units which was recorded as a reduction of additional paid-in-capital. During 2007, we used $1.6
billion in the direct repurchase of 57.9 million shares of our common stock at an average price of $27.34 per
share. In addition, certain restricted stock awards that vested during 2007 were subject to statutory tax
withholding obligations. We reacquired 70,000 shares of restricted stock awards to satisfy the tax withholding
obligations and $2 million was recorded as treasury stock. We paid $4 million related to the net share settlement
of 156,000 shares of restricted stock units which was recorded as a reduction of additional paid-in-capital.
48