Yahoo 2009 Annual Report Download - page 68
Download and view the complete annual report
Please find page 68 of the 2009 Yahoo annual report below. You can navigate through the pages in the report by either clicking on the pages listed below, or by using the keyword search tool below to find specific information within the annual report.-
 1
1 -
2
-
3
-
4
-
5
-
6
-
7
-
8
-
9
-
10
-
11
-
12
-
13
-
14
-
15
-
16
-
17
-
18
-
19
-
20
-
21
-
22
-
23
-
24
-
25
-
26
-
27
-
28
-
29
-
30
-
31
-
32
-
33
-
34
-
35
-
36
-
37
-
38
-
39
-
40
-
41
-
42
-
43
-
44
-
45
-
46
-
47
-
48
-
49
-
50
-
51
-
52
-
53
-
54
-
55
-
56
-
57
-
 58
58 -
 59
59 -
 60
60 -
 61
61 -
 62
62 -
 63
63 -
 64
64 -
 65
65 -
 66
66 -
 67
67 -
 68
68 -
 69
69 -
 70
70 -
 71
71 -
 72
72 -
 73
73 -
 74
74 -
 75
75 -
 76
76 -
 77
77 -
 78
78 -
79
-
80
-
81
-
82
-
83
-
84
-
85
-
86
-
87
-
88
-
89
-
90
-
91
-
92
-
93
-
94
-
95
-
96
-
97
-
98
-
99
-
100
-
101
-
102
-
103
-
104
-
105
-
106
-
107
-
108
-
109
-
110
-
111
-
112
-
113
-
114
-
115
-
116
-
117
-
118
-
119
-
120
-
121
-
122
-
123
-
124
-
125
-
126
-
127
-
128
-
129
-
130
-
131
-
132
-
133
-
134
 |
 |

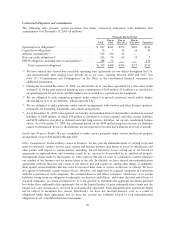
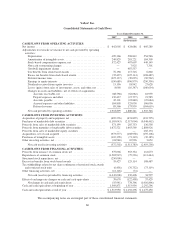
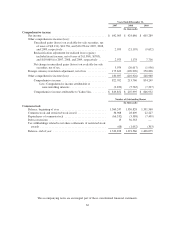
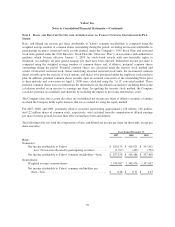
Yahoo! Inc.
Consolidated Statements of Cash Flows
Years Ended December 31,
2007 2008 2009
(In thousands)
CASH FLOWS FROM OPERATING ACTIVITIES:
Net income ................................................... $ 642,005 $ 424,686 $ 605,289
Adjustments to reconcile net income to net cash provided by operating
activities:
Depreciation .............................................. 409,366 508,812 554,546
Amortization of intangible assets .............................. 249,829 281,221 184,309
Stock-based compensation expense, net ........................ 572,427 407,607 449,149
Non-cash restructuring charges ............................... — 7,925 7,301
Goodwill impairment charge ................................. — 487,537 —
Tax benefits from stock-based awards .......................... 76,138 117,716 6,860
Excess tax benefits from stock-based awards .................... (35,427) (125,114) (108,487)
Deferred income taxes ...................................... (227,137) (39,035) (90,562)
Earnings in equity interests .................................. (150,689) (596,979) (250,390)
Dividends received from equity investees ....................... 15,156 18,942 27,628
Losses (gains) from sales of investments, assets, and other, net ...... 8,060 (10,347) (160,634)
Changes in assets and liabilities, net of effects of acquisitions:
Accounts receivable, net ................................ (88,738) (62,082) 81,959
Prepaid expenses and other .............................. 132,437 (15,777) 21,585
Accounts payable ...................................... 45,101 (23,840) (19,684)
Accrued expenses and other liabilities ...................... 184,805 325,030 106,096
Deferred revenue ...................................... 85,566 173,939 (104,619)
Net cash provided by operating activities ....................... 1,918,899 1,880,241 1,310,346
CASH FLOWS FROM INVESTING ACTIVITIES:
Acquisition of property and equipment, net .......................... (602,276) (674,829) (433,795)
Purchases of marketable debt securities ............................. (1,105,043) (2,317,004) (5,048,462)
Proceeds from sales of marketable debt securities ..................... 571,199 285,753 136,538
Proceeds from maturities of marketable debt securities ................. 1,672,521 1,663,569 2,884,926
Proceeds from sales of marketable equity securities ................... — — 265,194
Acquisitions, net of cash acquired ................................. (973,577) (208,958) (195,106)
Purchases of intangible assets .................................... (110,378) (71,310) (32,185)
Other investing activities, net ..................................... (24,948) 10,996 3,652
Net cash used in investing activities ........................... (572,502) (1,311,783) (2,419,238)
CASH FLOWS FROM FINANCING ACTIVITIES:
Proceeds from issuance of common stock, net ....................... 375,066 363,354 112,673
Repurchases of common stock .................................... (1,583,919) (79,236) (113,444)
Structured stock repurchases, net .................................. (250,000) — —
Excess tax benefits from stock-based awards ........................ 35,427 125,114 108,487
Tax withholdings related to net share settlements of restricted stock awards
and restricted stock units ...................................... (6,456) (76,752) (73,119)
Other financing activities, net .................................... (12,126) (74) —
Net cash (used in) provided by financing activities ................ (1,442,008) 332,406 34,597
Effect of exchange rate changes on cash and cash equivalents ........... 39,670 (122,498) 57,429
Net change in cash and cash equivalents ........................ (55,941) 778,366 (1,016,866)
Cash and cash equivalents at beginning of year ....................... 1,569,871 1,513,930 2,292,296
Cash and cash equivalents at end of year ............................ $1,513,930 $ 2,292,296 $ 1,275,430
The accompanying notes are an integral part of these consolidated financial statements.
60