Yahoo 2009 Annual Report Download - page 53
Download and view the complete annual report
Please find page 53 of the 2009 Yahoo annual report below. You can navigate through the pages in the report by either clicking on the pages listed below, or by using the keyword search tool below to find specific information within the annual report.-
 1
1 -
2
-
3
-
4
-
5
-
6
-
7
-
8
-
9
-
10
-
11
-
12
-
13
-
14
-
15
-
16
-
17
-
18
-
19
-
20
-
21
-
22
-
23
-
24
-
25
-
26
-
27
-
28
-
29
-
30
-
31
-
32
-
33
-
34
-
35
-
36
-
37
-
38
-
39
-
40
-
41
-
42
-
 43
43 -
 44
44 -
 45
45 -
 46
46 -
 47
47 -
 48
48 -
 49
49 -
 50
50 -
 51
51 -
 52
52 -
 53
53 -
 54
54 -
 55
55 -
 56
56 -
 57
57 -
 58
58 -
 59
59 -
 60
60 -
 61
61 -
 62
62 -
 63
63 -
64
-
65
-
66
-
67
-
68
-
69
-
70
-
71
-
72
-
73
-
74
-
75
-
76
-
77
-
78
-
79
-
80
-
81
-
82
-
83
-
84
-
85
-
86
-
87
-
88
-
89
-
90
-
91
-
92
-
93
-
94
-
95
-
96
-
97
-
98
-
99
-
100
-
101
-
102
-
103
-
104
-
105
-
106
-
107
-
108
-
109
-
110
-
111
-
112
-
113
-
114
-
115
-
116
-
117
-
118
-
119
-
120
-
121
-
122
-
123
-
124
-
125
-
126
-
127
-
128
-
129
-
130
-
131
-
132
-
133
-
134
 |
 |
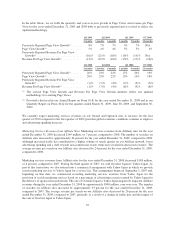
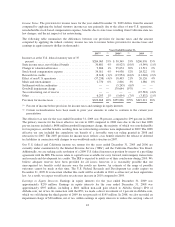
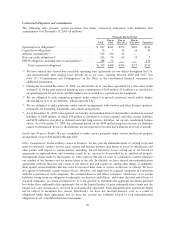
Revenues are attributed to individual countries according to the international online property that generated the
revenues. No single foreign country accounted for more than 10 percent of revenues in 2009, 2008, or 2007,
respectively.
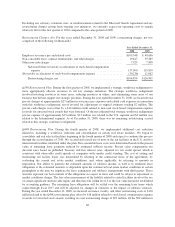
United States. U.S. revenues for the year ended December 31, 2009 decreased approximately $468 million, or 9
percent, as compared to 2008. Our year-over-year decrease in revenues was a result of a decline in advertising
across the majority of Yahoo! Properties, particularly search advertising, and in our fee-based services. The
decline in revenues was offset by a decline in operating expenses of $278 million for the year ended
December 31, 2009 as compared to 2008. U.S. revenues for the year ended December 31, 2008 increased
approximately $458 million, or 10 percent, as compared to 2007. The year-over-year increases in 2008 and 2007
were a result of growth in advertising across Yahoo! Properties. More than 95 percent of the 2008 increase, or
$453 million, came from marketing services revenues. U.S. operating income before depreciation, amortization,
and stock-based compensation expense for the year ended December 31, 2009 decreased $110 million, or 9
percent, as compared to 2008. U.S. operating income before depreciation, amortization, and stock-based
compensation expense for the year ended December 31, 2009 includes restructuring charges of $79 million. U.S.
operating income before depreciation, amortization, and stock-based compensation expense for the year ended
December 31, 2008 decreased $226 million, or 16 percent, as compared to 2007. U.S. operating income before
depreciation, amortization, and stock-based compensation expense for the year ended December 31, 2008
includes restructuring charges of $107 million.
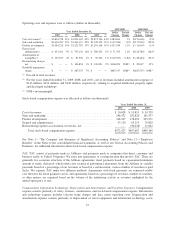
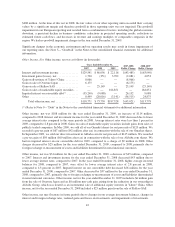
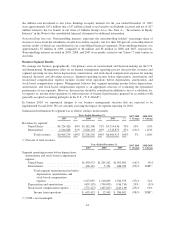
International. International revenues for the year ended December 31, 2009 decreased approximately $280
million or 14 percent compared to 2008. The decline in international revenues was mainly due to a decline in
advertising across the majority of Yahoo! Properties, the sale of Kelkoo SAS during the year ended
December 31, 2008, and the effects of foreign currency exchange rate fluctuations. The decline in revenues was
offset by a decline in operating expenses of $692 million for the year ended December 31, 2009 compared to
2008. International operating income before depreciation, amortization, and stock-based compensation expense
for the year ended December 31, 2009 increased $482 million compared to 2008. The increase in international
operating income before depreciation, amortization, and stock-based compensation expense year-over-year is
primarily due to the $488 million goodwill impairment charge related to our European reporting unit in 2008, for
which there was no similar charge in 2009. In addition, international operating loss before depreciation,
amortization, and stock-based compensation expense for the year ended December 31, 2009 included
restructuring charges of $28 million.
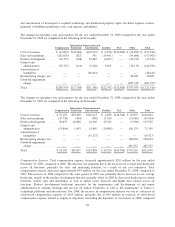
International revenues for the year ended December 31, 2008 decreased approximately $219 million, or 10
percent, compared to 2007. More than 95 percent of the international revenues decrease in 2008 came from
marketing services revenues. The year-over-year decrease is the result of the sale of Overture Japan to Yahoo
Japan which negatively impacted revenues by approximately $300 million. Previously, we earned search
marketing revenues from advertisers and paid TAC to Yahoo Japan. In the third quarter of 2007, we initiated a
new commercial arrangement with Yahoo Japan in which we now provide search marketing services to Yahoo
Japan for a service fee. Under this new arrangement, we record marketing services revenues from Yahoo Japan
for the provision of search marketing services based on a percentage of advertising revenues earned by Yahoo
Japan for the delivery of sponsored search results. International operating income before depreciation,
amortization, and stock-based compensation expense for the year ended December 31, 2008 decreased $491
million, or 99 percent, compared to 2007. The decrease in international operating income before depreciation,
amortization, and stock-based compensation expense year-over-year is primarily due to the $488 million
goodwill impairment charge related to our European reporting unit which is part of our International segment.
See Note 5—“Goodwill” in the Notes to the consolidated financial statements for additional information. In
addition, international operating loss before depreciation, amortization, and stock-based compensation expense
for the year ended December 31, 2008 includes restructuring charges of $30 million.
International revenues accounted for approximately 27 percent of total revenues during 2009, 28 percent of total
revenues during 2008, and 32 percent of total revenues during 2007. Our international operations expose us to
45