Yahoo 2009 Annual Report Download - page 118
Download and view the complete annual report
Please find page 118 of the 2009 Yahoo annual report below. You can navigate through the pages in the report by either clicking on the pages listed below, or by using the keyword search tool below to find specific information within the annual report.-
 1
1 -
2
-
3
-
4
-
5
-
6
-
7
-
8
-
9
-
10
-
11
-
12
-
13
-
14
-
15
-
16
-
17
-
18
-
19
-
20
-
21
-
22
-
23
-
24
-
25
-
26
-
27
-
28
-
29
-
30
-
31
-
32
-
33
-
34
-
35
-
36
-
37
-
38
-
39
-
40
-
41
-
42
-
43
-
44
-
45
-
46
-
47
-
48
-
49
-
50
-
51
-
52
-
53
-
54
-
55
-
56
-
57
-
58
-
59
-
60
-
61
-
62
-
63
-
64
-
65
-
66
-
67
-
68
-
69
-
70
-
71
-
72
-
73
-
74
-
75
-
76
-
77
-
78
-
79
-
80
-
81
-
82
-
83
-
84
-
85
-
86
-
87
-
88
-
89
-
90
-
91
-
92
-
93
-
94
-
95
-
96
-
97
-
98
-
99
-
100
-
101
-
102
-
103
-
104
-
105
-
106
-
107
-
 108
108 -
 109
109 -
 110
110 -
 111
111 -
 112
112 -
 113
113 -
 114
114 -
 115
115 -
 116
116 -
 117
117 -
 118
118 -
 119
119 -
 120
120 -
 121
121 -
 122
122 -
 123
123 -
 124
124 -
 125
125 -
 126
126 -
 127
127 -
 128
128 -
129
-
130
-
131
-
132
-
133
-
134
 |
 |

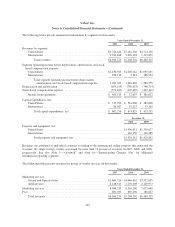
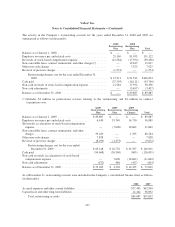
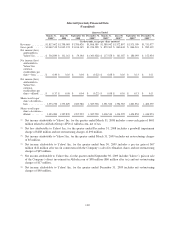
Selected Quarterly Financial Data
(Unaudited)
Quarters Ended
March 31,
2008(1)
June 30,
2008
September 30,
2008
December 31,
2008(2)
March 31,
2009(3)
June 30,
2009(4)
September 30,
2009(5)
December 31,
2009(6)
(In thousands, except per share amounts)
Revenues .......... $1,817,602 $1,798,085 $1,786,426 $1,806,389 $1,580,042 $1,572,897 $1,575,399 $1,731,977
Gross profit ........ $1,062,519 $1,032,174 $1,014,149 $1,076,298 $ 879,305 $ 860,444 $ 866,501 $ 982,319
Net income (loss)
attributable to
Yahoo! Inc. ...... $ 536,840 $ 131,161 $ 54,348 $ (303,428) $ 117,558 $ 141,387 $ 186,093 $ 152,954
Net income (loss)
attributable to
Yahoo! Inc.
common
stockholders per
share—basic ...... $ 0.40 $ 0.10 $ 0.04 $ (0.22) $ 0.08 $ 0.10 $ 0.13 $ 0.11
Net income (loss)
attributable to
Yahoo! Inc.
common
stockholders per
share—diluted .... $ 0.37 $ 0.09 $ 0.04 $ (0.22) $ 0.08 $ 0.10 $ 0.13 $ 0.11
Shares used in per
share calculation—
basic ............ 1,333,730 1,372,629 1,383,786 1,387,758 1,391,526 1,394,783 1,401,961 1,402,339
Shares used in per
share calculation—
diluted .......... 1,393,080 1,397,839 1,397,522 1,387,758 1,406,510 1,414,295 1,424,854 1,416,974
(1) Net income attributable to Yahoo! Inc. for the quarter ended March 31, 2008 includes a non-cash gain of $401
million related to Alibaba Group’s IPO of Alibaba.com, net of tax.
(2) Net loss attributable to Yahoo! Inc. for the quarter ended December 31, 2008 includes a goodwill impairment
charge of $488 million and net restructuring charges of $90 million.
(3) Net income attributable to Yahoo! Inc. for the quarter ended March 31, 2009 includes net restructuring charges
of $5 million.
(4) Net income attributable to Yahoo! Inc. for the quarter ended June 30, 2009 includes a pre-tax gain of $67
million ($42 million after tax) in connection with the Company’s sale of its Gmarket shares and net restructuring
charges of $65 million.
(5) Net income attributable to Yahoo! Inc. for the quarter ended September 30, 2009 includes Yahoo!’s gain on sale
of the Company’s direct investment in Alibaba.com of $98 million ($60 million after tax) and net restructuring
charges of $17 million.
(6) Net income attributable to Yahoo! Inc. for the quarter ended December 31, 2009 includes net restructuring
charges of $40 million.
110