APC 2007 Annual Report Download - page 101
Download and view the complete annual report
Please find page 101 of the 2007 APC annual report below. You can navigate through the pages in the report by either clicking on the pages listed below, or by using the keyword search tool below to find specific information within the annual report.-
 1
1 -
2
-
3
-
4
-
5
-
6
-
7
-
8
-
9
-
10
-
11
-
12
-
13
-
14
-
15
-
16
-
17
-
18
-
19
-
20
-
21
-
22
-
23
-
24
-
25
-
26
-
27
-
28
-
29
-
30
-
31
-
32
-
33
-
34
-
35
-
36
-
37
-
38
-
39
-
40
-
41
-
42
-
43
-
44
-
45
-
46
-
47
-
48
-
49
-
50
-
51
-
52
-
53
-
54
-
55
-
56
-
57
-
58
-
59
-
60
-
61
-
62
-
63
-
64
-
65
-
66
-
67
-
68
-
69
-
70
-
71
-
72
-
73
-
74
-
75
-
76
-
77
-
78
-
79
-
80
-
81
-
82
-
83
-
84
-
85
-
86
-
87
-
88
-
89
-
90
-
 91
91 -
 92
92 -
 93
93 -
 94
94 -
 95
95 -
 96
96 -
 97
97 -
 98
98 -
 99
99 -
 100
100 -
 101
101 -
 102
102 -
 103
103 -
 104
104 -
 105
105 -
 106
106 -
 107
107 -
 108
108 -
 109
109 -
 110
110 -
 111
111 -
112
-
113
-
114
-
115
-
116
-
117
-
118
-
119
-
120
-
121
-
122
-
123
-
124
-
125
-
126
-
127
-
128
-
129
-
130
-
131
-
132
-
133
-
134
-
135
-
136
-
137
-
138
-
139
-
140
-
141
-
142
-
143
-
144
-
145
-
146
-
147
-
148
-
149
-
150
-
151
-
152
-
153
-
154
-
155
-
156
-
157
-
158
-
159
-
160
-
161
-
162
-
163
-
164
-
165
-
166
-
167
-
168
-
169
-
170
-
171
-
172
-
173
-
174
-
175
-
176
-
177
-
178
-
179
-
180
-
181
-
182
-
183
-
184
-
185
-
186
-
187
-
188
-
189
-
190
 |
 |

99
4
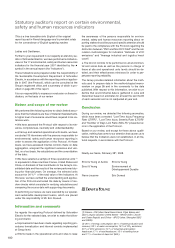
Business review
Frame of reference and definitions
In the absence of any recognized and meaningful bench-
mark for companies involved in manufacturing and as-
sembling electronic components, Schneider Electric has
drawn up a frame of reference with reporting methods for
human resources, safety and environment indicators. The
frame of reference includes all relevant definitions, meas-
urement procedures and methods for collecting informa-
tion. As part of its continuous improvement process,
Schneider Electric is gradually adapting the sustainable
development indicators as the Group evolves. The frame of
reference is regularly updated.
Consolidation scope and methods
Human resources and safety indicators are consolidated at
the worldwide level for all companies that are fully consol-
idated in the Group’s financial statements.
As concerns environmental data, all units certified to ISO
14001 must report. Production and logistics sites with 20 or
more employees are also included in the scope of consol-
idation after two full calendar years of operation. Adminis-
trative, R&D and sales sites may report on a voluntary
basis. In 2007, the scope of environmental reporting ex-
panded from 184 to 201 manufacturing and logistics sites,
in keeping with the policy of covering the broadest possi-
ble base. Units belonging to fully consolidated companies
are included on a 100% basis, as are units belonging to
proportionally consolidated companies. Companies ac-
counted for by the equity method are not included in the
reporting.
Data collection and monitoring
Human resources, safety and environment indicators are
drawn from several dedicated reporting sources available
on the Group’s intranet. Depending on their nature, the
data are consolidated by the Human Resources or the En-
vironmental Affairs departments. Data is checked during
consolidation, with a review of changes from the previous
year and inter-site comparisons. No estimates are used to
replace inconsistent or missing data. In keeping with its
commitment to continuous improvement, Schneider Elec-
tric asked Ernst & Young to conduct a review in order to
obtain a moderate level of assurance for certain human re-
sources, safety and environment indicators.
Calculation methods
Environmental data
CO2: The Group uses the method endorsed by the Inter-
national Energy Agency in 2006 to convert energy con-
sumption into CO2equivalent. The conversion factors may
be global (natural gas, fuel oil, diesel) or national (electric-
ity, urban heating, etc.).
Waste: the figures do not include exceptional waste, such
as that from building demolition.
ISO 14001 certification: the ISO 14001 indicator covers
211 manufacturing and logistics sites (including six site clo-
sures or consolidations during the year) compared with
201 for the other environmental indicators. ISO 14001 cer-
tification is one of the Planet & Society barometer’s per-
formance indicators.
Volatile Organic Compounds (VOCs): given the nature of
the Group’s business, an estimate was made of VOC emis-
sions in 2006 and 2007 to provide a rough approximation.
Product Environmental Profiles (PEPs): This indicator cor-
responds to the number of PEPs compiled by Schneider
Electric. It is one of the Planet & Society barometer’s per-
formance indicators.
Social data
Lost time injury rate per employee: this indicator is calcu-
lated monthly on the basis of working days and average
workforce. It includes all injury-related time off exceeding
one day during the past 12 months. The annual total cor-
responds to the sum of the monthly totals. Employees of
units that do not report a lost time injury figure are not in-
cluded in the denominator. This includes recent acquisi-
tions such as APC, MGE and Pelco. The lost time injury
rate is one of the Planet & Society barometer's perform-
ance indicators.
Health and retirement coverage: all units that provide ben-
efits for the three following areas are considered to offer
basic coverage: illness (benefits in cash or in kind), work
accidents (benefits in cash or in kind) and disability. The
indicator, which includes units acquired no less than two
months previously, is one of the Planet & Society barome-
ter’s performance indicators.
Number of hours of training: this indicator does not include
awareness-raising campaigns, which are not considered
to be part of training. The data is accounted for in hours as
of 2007.
Diversity: this indicator tracks the percentage of women
participating in international mobility programs, which
serve to identify high-potential talent within Schneider
Electric. Diversity is one of the Planet & Society barome-
ter’s performance indicators.
Global Compact: this indicator, which tracks the percent-
age of unit purchases made from Global Compact signa-
tories, covers the 2,000 largest referenced suppliers in the
Group’s supplier base. This tends to reduce the final
amount, given that suppliers who comply with the Elec-
tronic Industry Code of Conduct (EICC) also meet the
Global Compact’s requirements. The volume of purchases
from Global Compact signatories is one of the Planet &
Society barometer’s performance indicators.
Methodological limits
Methodologies used to establish environmental indicators
may provide incomplete data due to current-month esti-
mates made during reporting. These estimates, which rep-
resent a sixth of the period, are not adjusted afterwards.
Methodology underlying human resources,
safety and environmental indicators