APC 2007 Annual Report Download - page 160
Download and view the complete annual report
Please find page 160 of the 2007 APC annual report below. You can navigate through the pages in the report by either clicking on the pages listed below, or by using the keyword search tool below to find specific information within the annual report.-
 1
1 -
2
-
3
-
4
-
5
-
6
-
7
-
8
-
9
-
10
-
11
-
12
-
13
-
14
-
15
-
16
-
17
-
18
-
19
-
20
-
21
-
22
-
23
-
24
-
25
-
26
-
27
-
28
-
29
-
30
-
31
-
32
-
33
-
34
-
35
-
36
-
37
-
38
-
39
-
40
-
41
-
42
-
43
-
44
-
45
-
46
-
47
-
48
-
49
-
50
-
51
-
52
-
53
-
54
-
55
-
56
-
57
-
58
-
59
-
60
-
61
-
62
-
63
-
64
-
65
-
66
-
67
-
68
-
69
-
70
-
71
-
72
-
73
-
74
-
75
-
76
-
77
-
78
-
79
-
80
-
81
-
82
-
83
-
84
-
85
-
86
-
87
-
88
-
89
-
90
-
91
-
92
-
93
-
94
-
95
-
96
-
97
-
98
-
99
-
100
-
101
-
102
-
103
-
104
-
105
-
106
-
107
-
108
-
109
-
110
-
111
-
112
-
113
-
114
-
115
-
116
-
117
-
118
-
119
-
120
-
121
-
122
-
123
-
124
-
125
-
126
-
127
-
128
-
129
-
130
-
131
-
132
-
133
-
134
-
135
-
136
-
137
-
138
-
139
-
140
-
141
-
142
-
143
-
144
-
145
-
146
-
147
-
148
-
149
-
 150
150 -
 151
151 -
 152
152 -
 153
153 -
 154
154 -
 155
155 -
 156
156 -
 157
157 -
 158
158 -
 159
159 -
 160
160 -
 161
161 -
 162
162 -
 163
163 -
 164
164 -
 165
165 -
 166
166 -
 167
167 -
 168
168 -
 169
169 -
 170
170 -
171
-
172
-
173
-
174
-
175
-
176
-
177
-
178
-
179
-
180
-
181
-
182
-
183
-
184
-
185
-
186
-
187
-
188
-
189
-
190
 |
 |

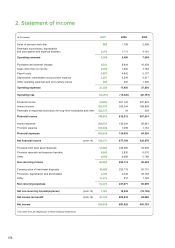
2. Statement of income
(thousands) 2007 2006 2005
Sales of services and other 986 1,769 2,908
Reversals of provisions, depreciation
and amortization and expense transfers 2,079 1,711 4,191
Operating revenues 3,065 3,480 7,099
Purchases and external charges 9,341 8,944 16,429
Taxes other than on income 2,033 1,600 2,783
Payroll costs 6,897 4,842 5,137
Depreciation, amortization and provision expense 2,501 2,209 2,217
Other operating expenses and joint-venture losses 584 305 1,290
Operating expenses 21,356 17,900 27,856
Operating loss (18,291) (14,420) (20,757)
Dividend income 20,930 557,104 337,833
Interest income 402,747 255,244 168,809
Reversals of impairment provisions for long-term receivables and other 322,137 24 359
Financial income 745,814 812,372 507,001
Interest expense 269,737 133,504 82,661
Provision expense 323,906 1,099 1,764
Financial expenses 593,643 134,603 84,425
Net financial income
(note 14)
152,171 677,769 422,576
Proceeds from fixed asset disposals 52,557 243,585 53,639
Provision reversals and expense transfers 5,860 2,830 6,076
Other 6,049 6,699 5,788
Non-recurring income 64,466 253,114 65,503
Carrying value of fixed asset disposals 49,468 232,719 50,701
Provisions, depreciation and amortization 2,100 4,042 32,762
Other 11,511 910 1,146
Non-recurring expenses 63,079 237,671 84,609
Net non-recurring income/(expense)
(note 15)
1,387 15,443 (19,106)
Net income tax benefit
(note 16)
91,376 209,033 68,080
Net income 226,643 887,825 450,793
The notes form an integral part of these financial statements.
158