APC 2007 Annual Report Download - page 89
Download and view the complete annual report
Please find page 89 of the 2007 APC annual report below. You can navigate through the pages in the report by either clicking on the pages listed below, or by using the keyword search tool below to find specific information within the annual report.-
 1
1 -
2
-
3
-
4
-
5
-
6
-
7
-
8
-
9
-
10
-
11
-
12
-
13
-
14
-
15
-
16
-
17
-
18
-
19
-
20
-
21
-
22
-
23
-
24
-
25
-
26
-
27
-
28
-
29
-
30
-
31
-
32
-
33
-
34
-
35
-
36
-
37
-
38
-
39
-
40
-
41
-
42
-
43
-
44
-
45
-
46
-
47
-
48
-
49
-
50
-
51
-
52
-
53
-
54
-
55
-
56
-
57
-
58
-
59
-
60
-
61
-
62
-
63
-
64
-
65
-
66
-
67
-
68
-
69
-
70
-
71
-
72
-
73
-
74
-
75
-
76
-
77
-
78
-
 79
79 -
 80
80 -
 81
81 -
 82
82 -
 83
83 -
 84
84 -
 85
85 -
 86
86 -
 87
87 -
 88
88 -
 89
89 -
 90
90 -
 91
91 -
 92
92 -
 93
93 -
 94
94 -
 95
95 -
 96
96 -
 97
97 -
 98
98 -
 99
99 -
100
-
101
-
102
-
103
-
104
-
105
-
106
-
107
-
108
-
109
-
110
-
111
-
112
-
113
-
114
-
115
-
116
-
117
-
118
-
119
-
120
-
121
-
122
-
123
-
124
-
125
-
126
-
127
-
128
-
129
-
130
-
131
-
132
-
133
-
134
-
135
-
136
-
137
-
138
-
139
-
140
-
141
-
142
-
143
-
144
-
145
-
146
-
147
-
148
-
149
-
150
-
151
-
152
-
153
-
154
-
155
-
156
-
157
-
158
-
159
-
160
-
161
-
162
-
163
-
164
-
165
-
166
-
167
-
168
-
169
-
170
-
171
-
172
-
173
-
174
-
175
-
176
-
177
-
178
-
179
-
180
-
181
-
182
-
183
-
184
-
185
-
186
-
187
-
188
-
189
-
190
 |
 |

87
4
Business review
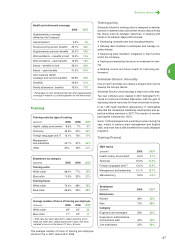
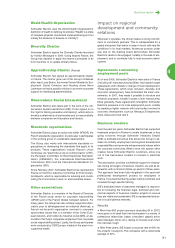
Training
Training costs by type of training
(percent)
2005 2006 2007
Health, safety, environment 8.9% 7% 6%
Technical 33.3% 30% 26%
Foreign languages and IT 13.1% 13% 17%
Management
and leadership 24.7% 31% 30%
Other 20% 19% 21%
Breakdown by category
(percent)
2005 2006 2007
Training costs
White collar 88.4% 77% 79%
Blue collar 11.6% 23% 21%
Training hours
White collar 70.4% 68% 72%
Blue collar 29.6% 32% 28%
Main topics
(percent)
2006 2007
Health, safety, environment 8.5% 8.7%
Technical 19.0% 17.3%
Foreign languages and IT 13.5% 13.4%
Management and leadership 12.1% 13.7%
Manufacturing 9.9% 9.6%
Average number of hours of training per employee
(in hours)
2005 2006 2007
White collar 38* 33* 34
Blue collar 17* 22* 17
* 2006 data has been adjusted to reflect reporting errors.
2005 and 2006 data, initially expressed in days, has been
restated in hours on the basis of 1 day = 8 hours.
The average number of hours of training per employee
stood at 27in 2007 versus 28 in 2006.
Training policy
Schneider Electric’s training policy is designed to develop
and lock-in talented men and women whose skills will help
the Group meet its strategic objectives, in keeping with
trends in its markets. Major paths include:
Developing competencies and changing behavior.
Allowing team members to anticipate and manage on-
going change.
Deepening team members’ integration in their function
and in the Company.
Tracking and evaluating the return on investment in train-
ing.
Meeting current and future needs for improving per-
formance.
Schneider Electric University
One of new2’s priorities is to deploy a shared vision and to
develop the Group’s talents.
Schneider Electric University plays a major role in this area.
Two new institutes were created in 2007 dedicated to Fi-
nance & Control and Human Resources, with the goal of
deploying shared resources for these horizontal functions.
In all, 1,837 team members representing 71 nationalities
attended the University’s leadership development and ex-
pertise building seminars in 2007. The number of women
participants increased by 155%.
Some 7,000 employees took e-learning courses during the
year, mainly to improve team management and English
skills, and more than 6,000 benefited from locally deployed
programs.
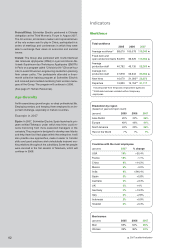
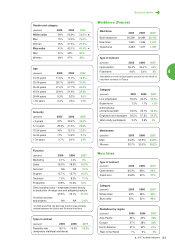
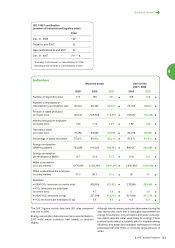
Training (France)
Breakdown
(percent)
2006 2007
Men/women
Women 28% 32%
Men 72% 68%
Category
Engineers and managers 28% 33%
Supervisors, administrative
and technical staff 40% 38%
Line employees 32% 29%
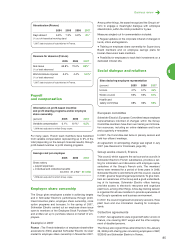
Health and retirement coverage
2006 2007
Supplementary coverage
offered by the Company*
Unemployment 5.2% 4%
Social security pension benefits 26.1% 32%
Supplementary pension benefits 35.2% 45%
Work accidents – benefits in kind 12.4% 13%
Work accidents – cash benefits 19.3% 18%
Illness – benefits in kind 35.4% 42%
Illness – cash benefits 41.3% 51%
Life insurance (death
coverage and survivor benefits) 60.8% 64%
Disability 49.6% 51%
Family allowances - benefits 16.0% 17%
* Percentage of units declaring that they offer supplementary
coverage in relation to current legislation for the items listed.