APC 2007 Annual Report Download - page 86
Download and view the complete annual report
Please find page 86 of the 2007 APC annual report below. You can navigate through the pages in the report by either clicking on the pages listed below, or by using the keyword search tool below to find specific information within the annual report.-
 1
1 -
2
-
3
-
4
-
5
-
6
-
7
-
8
-
9
-
10
-
11
-
12
-
13
-
14
-
15
-
16
-
17
-
18
-
19
-
20
-
21
-
22
-
23
-
24
-
25
-
26
-
27
-
28
-
29
-
30
-
31
-
32
-
33
-
34
-
35
-
36
-
37
-
38
-
39
-
40
-
41
-
42
-
43
-
44
-
45
-
46
-
47
-
48
-
49
-
50
-
51
-
52
-
53
-
54
-
55
-
56
-
57
-
58
-
59
-
60
-
61
-
62
-
63
-
64
-
65
-
66
-
67
-
68
-
69
-
70
-
71
-
72
-
73
-
74
-
75
-
 76
76 -
 77
77 -
 78
78 -
 79
79 -
 80
80 -
 81
81 -
 82
82 -
 83
83 -
 84
84 -
 85
85 -
 86
86 -
 87
87 -
 88
88 -
 89
89 -
 90
90 -
 91
91 -
 92
92 -
 93
93 -
 94
94 -
 95
95 -
 96
96 -
97
-
98
-
99
-
100
-
101
-
102
-
103
-
104
-
105
-
106
-
107
-
108
-
109
-
110
-
111
-
112
-
113
-
114
-
115
-
116
-
117
-
118
-
119
-
120
-
121
-
122
-
123
-
124
-
125
-
126
-
127
-
128
-
129
-
130
-
131
-
132
-
133
-
134
-
135
-
136
-
137
-
138
-
139
-
140
-
141
-
142
-
143
-
144
-
145
-
146
-
147
-
148
-
149
-
150
-
151
-
152
-
153
-
154
-
155
-
156
-
157
-
158
-
159
-
160
-
161
-
162
-
163
-
164
-
165
-
166
-
167
-
168
-
169
-
170
-
171
-
172
-
173
-
174
-
175
-
176
-
177
-
178
-
179
-
180
-
181
-
182
-
183
-
184
-
185
-
186
-
187
-
188
-
189
-
190
 |
 |

84
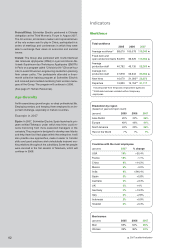
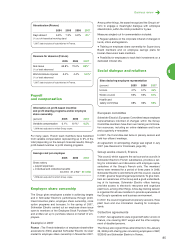
Reasons for dismissals
As part of the Group’s strategy of geographic re-balanc-
ing, involving the redeployment manufacturing resources,
workforce has risen noticeably in countries like China and
India.
At the same time, plans have been deployed in Western
Europe and the United States, for example, to rightsize the
Group’s manufacturing and supply chain base. In certain
cases, these plans led to headcount reductions. The Group
took assertive steps going beyond its legal obligations to
assist employees in re-directing their careers at all con-
cerned sites.
Examples in 2007
Europe : On July 12, 2007, Schneider Electric and the
European Metalworkers’ Federation (EMF) signed a Eu-
ropean agreement on anticipating change. Drawn up
within the framework of the European Committee, the
agreement reflects a deep commitment to supporting
Schneider Electric employees and helping them develop
skills throughout their careers.
France : Schneider Electric has taken active measures to
manage the social aspects of industrial restructuring since
signing an agreement in 2006 with government authorities
to help re-invigorate affected employment pools.
In Barentin, a job-creation target of 77 jobs was set. By
end-2007, 93 jobs had been created, of which nine were
filled by disadvantaged young people (in partnership with
Association pour le Droit à l’Initiative Economique
(ADIE)
and
Association Alizé
).
Dismissals
Workweek organization
and management
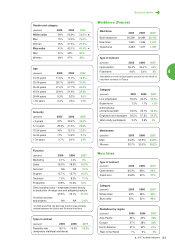
In Dijon, a job-creation target 50 jobs was set in part-
nership with ADIE. By end-2007, 53 jobs had been cre-
ated, of which 13 were filled by disadvantaged young
people.
Other employment support plans were required in 2007,
notably in Grenoble, Dijon and Angoulême. As these sites
were not covered by re-invigoration agreements, specific,
individualized support was offered to employees who
were part of a voluntary departure program. Options in-
cluded end-of-career payments and support for personal
projects, business creation or continuation and geo-
graphic mobility.
Contractors -
Staff from temporary agencies
% change
2005 2006 2007
Number 4,460 3,795 4,543
o/w layoffs for
economic reasons 1,070 620 944
Type of contract
(percent)
2005 2006 2007
Open-ended 85.8% 88.5% 83.5%
Fixed-term 14.2% 11.5% 16.5%
Category
(percent)
2005 2006 2007
White collar 37.5% 35.4% 45.1%
Blue collar 62.5% 64.6% 54.9%
Breakdown by region
(percent)
2005 2006 2007
Asia-Pacific 17% 15% 19%
Europe 25% 27% 30%
North America 52% 50% 44%
Rest of the World 6% 8% 7%
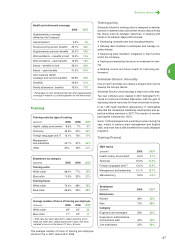
Temporary staff
2005 2006 2007
Total NA NA 9 610
White collar (%) NA NA 26.8%
Blue collar (%) NA NA 73.2%
Breakdown by region
(percent)
2005 2006 2007
Asia-Pacific NA NA 39%
Europe NA NA 50%
North America NA NA 5%
Rest of the World NA NA 6%
Temporary staff (France)
2005 2006 2007
Total 2,457 2,810 2,412
White collar (%) 12% 11% 13.6%
Blue collar (%) 88% 89% 86.4%
Average annual hours worked
2005 2006 2007
Number of hours NA 2,076 2,011
Part-time or flex-time employees (France)
2005 2006 2007
Total 1,456 1,387 1,234
% of employees
7.09% 6.81% 6.12%
Breakdown
Men 1.52% 1.48% 2.47%
Women 18.05% 17.46% 15.25%