APC 2007 Annual Report Download - page 88
Download and view the complete annual report
Please find page 88 of the 2007 APC annual report below. You can navigate through the pages in the report by either clicking on the pages listed below, or by using the keyword search tool below to find specific information within the annual report.-
 1
1 -
2
-
3
-
4
-
5
-
6
-
7
-
8
-
9
-
10
-
11
-
12
-
13
-
14
-
15
-
16
-
17
-
18
-
19
-
20
-
21
-
22
-
23
-
24
-
25
-
26
-
27
-
28
-
29
-
30
-
31
-
32
-
33
-
34
-
35
-
36
-
37
-
38
-
39
-
40
-
41
-
42
-
43
-
44
-
45
-
46
-
47
-
48
-
49
-
50
-
51
-
52
-
53
-
54
-
55
-
56
-
57
-
58
-
59
-
60
-
61
-
62
-
63
-
64
-
65
-
66
-
67
-
68
-
69
-
70
-
71
-
72
-
73
-
74
-
75
-
76
-
77
-
 78
78 -
 79
79 -
 80
80 -
 81
81 -
 82
82 -
 83
83 -
 84
84 -
 85
85 -
 86
86 -
 87
87 -
 88
88 -
 89
89 -
 90
90 -
 91
91 -
 92
92 -
 93
93 -
 94
94 -
 95
95 -
 96
96 -
 97
97 -
 98
98 -
99
-
100
-
101
-
102
-
103
-
104
-
105
-
106
-
107
-
108
-
109
-
110
-
111
-
112
-
113
-
114
-
115
-
116
-
117
-
118
-
119
-
120
-
121
-
122
-
123
-
124
-
125
-
126
-
127
-
128
-
129
-
130
-
131
-
132
-
133
-
134
-
135
-
136
-
137
-
138
-
139
-
140
-
141
-
142
-
143
-
144
-
145
-
146
-
147
-
148
-
149
-
150
-
151
-
152
-
153
-
154
-
155
-
156
-
157
-
158
-
159
-
160
-
161
-
162
-
163
-
164
-
165
-
166
-
167
-
168
-
169
-
170
-
171
-
172
-
173
-
174
-
175
-
176
-
177
-
178
-
179
-
180
-
181
-
182
-
183
-
184
-
185
-
186
-
187
-
188
-
189
-
190
 |
 |

86
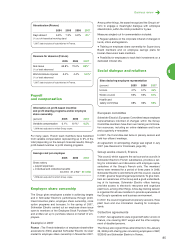
In all, 43 negotiation or agreement tracking meetings were
held during the year, equivalent to 34 full days.
People Scope
To achieve new2’s goal of "improving together", Schneider
Electric leverages the
People Scope
internal satisfaction
survey, which also serves as a reference for benchmarking
with other companies. The 56-question survey is adminis-
tered to all Group employees every other year. The next
survey will be conducted in 2008.
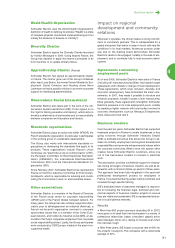
Health and safety
Health/safety
In designing its policies in 2006, Schneider Electric
adopted the World Health Organization's definition of
health: "Health is a state of complete physical, mental and
social well-being and not merely the absence of disease or
infirmity".
For Schneider Electric, health is a challenge shared by all
of its team members and partners. The Group also con-
siders that insurance coverage is a crucial lever for main-
taining a high level of good health. It believes in deploying
local approaches to achieve its goal of being the health
benchmark in all host countries.
Deployment
Schneider Electric created the
Health Policy Deployment
(HPD) indicator to track the deployment of its health pol-
icy across the Group. The indicator comprises three sub-
criteria:
- Local language translation of the policy and distribution to
all employees.
- Percentage of team members with coverage for work ac-
cidents, illness and disability.
- Formal health/safety management system in each unit
that complies with an international benchmark.
Management involvement
- Sponsors: Units with the most critical accident records
are tracked individually by a member of Senior Manage-
ment.
- All managers: Since 2006, significantly improving safety
has become a criterion in managerial compensation. This
principle will be gradually extended to other countries.
Local measures that contribute to the global action plan
- Health management system: The Group encourages all
its units to adopt an occupational health management sys-
tem in line with the main international standards (ILO OSH
and OHSAS). The units may decide to apply for certifica-
tion if they wish. In 2007, 15% of the Group’s sites were in-
volved in this process.
- Good practices: To share good practices, the Group pro-
motes local initiatives on a new Health Community intranet
site. In addition, 55 projects covering all areas of health
policy were submitted in the new2awards competition,
demonstrating the units’ commitment to health.
- Worldwide awareness campaign: A prevention campaign
prepared in 2007 and launched in early 2008 covers
health, safety and other issues. It is based on the guiding
concept of Schneider Electric’s health policy, which is that
responsibility is a commitment shared by employees, the
Company and its managers. The campaign will run
throughout the year, with quarterly messages.
Examples in 2007
France: Schneider Electric is working with France’s na-
tional conservatory of arts and crafts (CNAM) to define the
interaction between health, profession and efficiency and
use this information in management.
Argentina: During the year, Schneider Electric Argentina’s
health and safety management system was certified to
OHSAS 18001 standards. The subsidiary already has
quality (ISO 9001) and environmental (ISO 14001) certi-
fication. The system establishes a process to ensure that
working conditions comply with legal requirements at each
site, fosters a pleasant working atmosphere and improves
operating efficiency.
Indonesia: Schneider Electric Manufacturing Batam is
now certified ISO 14001 and OHSAS 18001. Additional
measures included medical check-ups for all operators and
a health/safety competition for all employees and their fam-
ilies. These efforts have led to a more than sixfold decline
in the number of lost days due to work accidents since
2004.
Sweden: A stress-prevention campaign was launched in
response to the sharp increase seen in national statistics
concerning this issue.
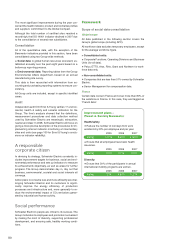
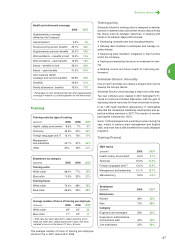
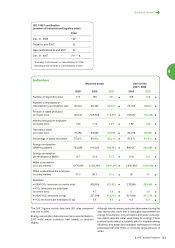
Accidents by category
2006 2007
Total accidents 1,936 2,335
Fatal accidents 3 4*
Serious accidents 346 296
Minor accidents 1,587 2,035
* Three of the four fatalities in 2007 occurred during commutes
and the fourth resulted from a work accident at a production site
in Brazil.
Frequency rate/severity rate
2005 2006 2007
Frequency rate 16.7 9.8 9.5
Blue collar NA NA 14.7
White collar NA NA 5
Severity rate 0.16 0.10 0.08
Blue collar NA NA 0.12
White collar NA NA 0.04
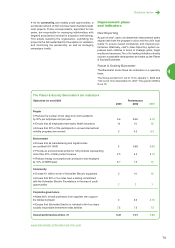
2007 audited indicators
The number of days lost per employee per year due to ac-
cidents declined to 0.167 days in 2007 from 0.198 in
2006*. The 2007 figure covers the entire consolidated
scope, except for Pelco and APC.
*Long-term absences in the Asia-Pacific zone have been removed
from 2006 data.