APC 2007 Annual Report Download - page 104
Download and view the complete annual report
Please find page 104 of the 2007 APC annual report below. You can navigate through the pages in the report by either clicking on the pages listed below, or by using the keyword search tool below to find specific information within the annual report.-
 1
1 -
2
-
3
-
4
-
5
-
6
-
7
-
8
-
9
-
10
-
11
-
12
-
13
-
14
-
15
-
16
-
17
-
18
-
19
-
20
-
21
-
22
-
23
-
24
-
25
-
26
-
27
-
28
-
29
-
30
-
31
-
32
-
33
-
34
-
35
-
36
-
37
-
38
-
39
-
40
-
41
-
42
-
43
-
44
-
45
-
46
-
47
-
48
-
49
-
50
-
51
-
52
-
53
-
54
-
55
-
56
-
57
-
58
-
59
-
60
-
61
-
62
-
63
-
64
-
65
-
66
-
67
-
68
-
69
-
70
-
71
-
72
-
73
-
74
-
75
-
76
-
77
-
78
-
79
-
80
-
81
-
82
-
83
-
84
-
85
-
86
-
87
-
88
-
89
-
90
-
91
-
92
-
93
-
 94
94 -
 95
95 -
 96
96 -
 97
97 -
 98
98 -
 99
99 -
 100
100 -
 101
101 -
 102
102 -
 103
103 -
 104
104 -
 105
105 -
 106
106 -
 107
107 -
 108
108 -
 109
109 -
 110
110 -
 111
111 -
 112
112 -
 113
113 -
 114
114 -
115
-
116
-
117
-
118
-
119
-
120
-
121
-
122
-
123
-
124
-
125
-
126
-
127
-
128
-
129
-
130
-
131
-
132
-
133
-
134
-
135
-
136
-
137
-
138
-
139
-
140
-
141
-
142
-
143
-
144
-
145
-
146
-
147
-
148
-
149
-
150
-
151
-
152
-
153
-
154
-
155
-
156
-
157
-
158
-
159
-
160
-
161
-
162
-
163
-
164
-
165
-
166
-
167
-
168
-
169
-
170
-
171
-
172
-
173
-
174
-
175
-
176
-
177
-
178
-
179
-
180
-
181
-
182
-
183
-
184
-
185
-
186
-
187
-
188
-
189
-
190
 |
 |

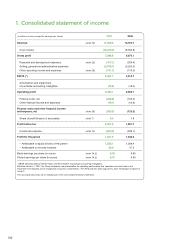
1. Consolidated statement of income
(in millions of euros except for earnings per share)
2007 2006
Revenue
(note 22)
17,308.6 13,729.7
Cost of sales (10,210.0) (8,050.6)
Gross profit 7,098.6 5,679.1
Research and development expenses
(note 23)
(417.1) (324.4)
Selling, general and administrative expenses (3,978.1) (3,220.0)
Other operating income and expenses
(note 25)
(141.7) (116.0)
EBITA (*) 2,561.7 2,018.7
Amortization and impairment
of purchase accounting intangibles (78.6) (18.0)
Operating profit 2,483.1 2,000.7
Finance costs, net (246.8) (104.0)
Other financial income and expenses (19.1) (16.9)
Finance costs and other financial income
and expense, net
(note 26)
(265.9) (120.9)
Share of profit/(losses) of associates
(note 7)
4.3 1.9
Profit before tax 2,221.5 1,881.7
Income tax expense
(note 12)
(600.0) (535.1)
Profit for the period 1,621.5 1,346.6
– Attributable to equity holders of the parent 1,583.1 1,309.4
– Attributable to minority interests 38.4 37.2
Basic earnings per share (in euros)
(note 14.3)
6.78 5.95
Diluted earnings per share (in euros)
(note 14.3)
6.70 5.90
* EBITA (Earnings Before Interest Taxes and Amortization of purchase accounting intangibles).
Effective January 1, 2007, the Group adopted a new presentation for operating performance that separates out amortization and
impairment of intangible assets recognized in business combinations. The 2006 data has been adjusted to allow meaningful comparison
(note 2).
The accompanying notes are an integral part of the consolidated financial statements.
102