APC 2007 Annual Report Download - page 96
Download and view the complete annual report
Please find page 96 of the 2007 APC annual report below. You can navigate through the pages in the report by either clicking on the pages listed below, or by using the keyword search tool below to find specific information within the annual report.-
 1
1 -
2
-
3
-
4
-
5
-
6
-
7
-
8
-
9
-
10
-
11
-
12
-
13
-
14
-
15
-
16
-
17
-
18
-
19
-
20
-
21
-
22
-
23
-
24
-
25
-
26
-
27
-
28
-
29
-
30
-
31
-
32
-
33
-
34
-
35
-
36
-
37
-
38
-
39
-
40
-
41
-
42
-
43
-
44
-
45
-
46
-
47
-
48
-
49
-
50
-
51
-
52
-
53
-
54
-
55
-
56
-
57
-
58
-
59
-
60
-
61
-
62
-
63
-
64
-
65
-
66
-
67
-
68
-
69
-
70
-
71
-
72
-
73
-
74
-
75
-
76
-
77
-
78
-
79
-
80
-
81
-
82
-
83
-
84
-
85
-
 86
86 -
 87
87 -
 88
88 -
 89
89 -
 90
90 -
 91
91 -
 92
92 -
 93
93 -
 94
94 -
 95
95 -
 96
96 -
 97
97 -
 98
98 -
 99
99 -
 100
100 -
 101
101 -
 102
102 -
 103
103 -
 104
104 -
 105
105 -
 106
106 -
107
-
108
-
109
-
110
-
111
-
112
-
113
-
114
-
115
-
116
-
117
-
118
-
119
-
120
-
121
-
122
-
123
-
124
-
125
-
126
-
127
-
128
-
129
-
130
-
131
-
132
-
133
-
134
-
135
-
136
-
137
-
138
-
139
-
140
-
141
-
142
-
143
-
144
-
145
-
146
-
147
-
148
-
149
-
150
-
151
-
152
-
153
-
154
-
155
-
156
-
157
-
158
-
159
-
160
-
161
-
162
-
163
-
164
-
165
-
166
-
167
-
168
-
169
-
170
-
171
-
172
-
173
-
174
-
175
-
176
-
177
-
178
-
179
-
180
-
181
-
182
-
183
-
184
-
185
-
186
-
187
-
188
-
189
-
190
 |
 |

94
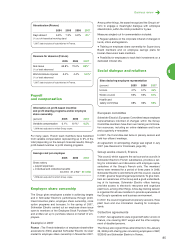
Water and energy consumption
Since 2006, the Group has provided a more detailed
breakdown of water consumption that takes into account
groundwater and water from the public network. Water
used solely for cooling and then immediately released with-
out any change is voluntarily included in the statistics.
Water and energy consumption data are consolidated in
the facing table.
Raw materials consumption
In its ongoing drive to protect the environment, Schneider
Electric is making its products more compact to conserve
natural resources and constantly improving its lineup to
make electrical installations more energy efficient.
To facilitate end-of-life processing, it chooses materials that
are easy to recycle and clip-together systems that are easy
to disassemble. Life cycle analyses and recyclability as-
sessments help the Group identify areas for improvement.
Example in 2007
New Modicon M340 automation platform for the in-
dustry market
Improvements over the previous range, designed in 1996:
25% decrease in energy consumption.
80% recyclable (versus 60% previously).
70% lighter (product + packaging).
RoHS compliant.
"Green Product" label for the Chinese market.
An Environmental Profile (PEP) has been published for this
product.
Supply chain
In 2007, Schneider Electric’s units focused on streamlin-
ing the supply chain, a clear source of carbon emissions.
To address this issue:
A dedicated global corporate team was set up to get an
overall view of international air and sea shipments, opti-
mize purchasing and shift air freight towards sea ship-
ments.
A plan to optimize pan-European flows was to devised to
make road haulage more effective, notably by improving
the truck fill rate.
An outside contractor monitored invoices to map out all
shipments from start to finish (origin, destination, shipping
method). A pilot program is under way in France and Spain,
with the goal of deploying across Europe in 2008.
In 2008, a team member will in charge of implementing pilot
projects to test alternative shipping system (rail, barge,
short sea, etc.).
Examples in 2007
Japan: Schneider Electric Japan reduced its consump-
tion of cardboard boxes and packing materials by a factor
of eight on a same-sales basis between 2004 and 2007 by
using plastic tubs for regular flows, re-using most boxes
and packing materials from customer shipping with no
change in the quality of customer service.
Carbon audit
A forward-looking approach
Schneider Electric and its units worldwide are not required
to hold CO2emission permits.
Nevertheless, a world leader like Schneider Electric who
has taken determined steps to optimize energy efficiency
and understand the planet’s great new societal and envi-
ronmental challenges felt compelled to be fully transpar-
ent about its own carbon emissions.
Even though its industrial processes do not consume huge
amounts of energy, the Group wanted carry out a carbon
audit covering its own emissions, as well as those of sup-
pliers, supply chain and other partners so that it could base
its strategic decisions on both business and environmen-
tal indicators.
To be sure, a forward-looking approach is all the more nec-
essary in today’s environment of sharply fluctuating energy
costs, as experts are now confirming the direct relation-
ship between carbon emissions and the amount and type
of energy consumed.
What’s more, by putting itself through the audit process,
Schneider Electric can also gain a better understanding of
the issues and factory floor reality encountered by its large
energy-consuming customers.
Method
Schneider Electric’s carbon audit covers:
All of its suppliers.
The internal supply chain.
The upstream and downstream supply chains.
Management of all buildings.
All business trips.
The Group’s general operations.
The method used corresponds to version 4 of the French
Agency for Environment and Energy Management’s car-
bon audit.
A vast, more than 8-month formalization program involv-
ing purchasing, supply chain, accounting, manufacturing
and the Group’s environmental managers was required to
obtain the final results.
Performance
All of the items covered can represent around two million
metric tons of carbon. Half of these emissions are related
to materials and components, a third to supply chain ac-
tivities and the rest to energy used by business trips, man-
ufacturing procedures and buildings.
2008 action plans
An additional study of carbon emissions from recycling
of Schneider Electric products.
A business and environmental improvement plan for all
of Schneider Electric’s supply chain activities.
Directives on business trips and alternative ways of
meeting using communication technologies such as video
or telephone conferences.