APC 2007 Annual Report Download - page 68
Download and view the complete annual report
Please find page 68 of the 2007 APC annual report below. You can navigate through the pages in the report by either clicking on the pages listed below, or by using the keyword search tool below to find specific information within the annual report.-
 1
1 -
2
-
3
-
4
-
5
-
6
-
7
-
8
-
9
-
10
-
11
-
12
-
13
-
14
-
15
-
16
-
17
-
18
-
19
-
20
-
21
-
22
-
23
-
24
-
25
-
26
-
27
-
28
-
29
-
30
-
31
-
32
-
33
-
34
-
35
-
36
-
37
-
38
-
39
-
40
-
41
-
42
-
43
-
44
-
45
-
46
-
47
-
48
-
49
-
50
-
51
-
52
-
53
-
54
-
55
-
56
-
57
-
 58
58 -
 59
59 -
 60
60 -
 61
61 -
 62
62 -
 63
63 -
 64
64 -
 65
65 -
 66
66 -
 67
67 -
 68
68 -
 69
69 -
 70
70 -
 71
71 -
 72
72 -
 73
73 -
 74
74 -
 75
75 -
 76
76 -
 77
77 -
 78
78 -
79
-
80
-
81
-
82
-
83
-
84
-
85
-
86
-
87
-
88
-
89
-
90
-
91
-
92
-
93
-
94
-
95
-
96
-
97
-
98
-
99
-
100
-
101
-
102
-
103
-
104
-
105
-
106
-
107
-
108
-
109
-
110
-
111
-
112
-
113
-
114
-
115
-
116
-
117
-
118
-
119
-
120
-
121
-
122
-
123
-
124
-
125
-
126
-
127
-
128
-
129
-
130
-
131
-
132
-
133
-
134
-
135
-
136
-
137
-
138
-
139
-
140
-
141
-
142
-
143
-
144
-
145
-
146
-
147
-
148
-
149
-
150
-
151
-
152
-
153
-
154
-
155
-
156
-
157
-
158
-
159
-
160
-
161
-
162
-
163
-
164
-
165
-
166
-
167
-
168
-
169
-
170
-
171
-
172
-
173
-
174
-
175
-
176
-
177
-
178
-
179
-
180
-
181
-
182
-
183
-
184
-
185
-
186
-
187
-
188
-
189
-
190
 |
 |

66
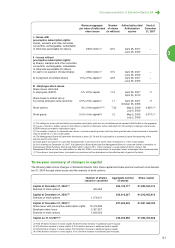
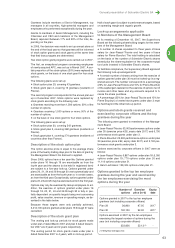
Stock grant plan details
Plan Plan Initial Initial Vesting Lock-up Vesting % of Cancelled Grants Grants Grants Grants
no. date number of number of period period conditions target grants made to made to cancelled outstanding
grantees grants met
(1)
corporate top 10 during at
officers employee the year Dec. 31,
(2)
grantees
(2)
2007
1 Dec. 21, 221 52,006 3 years 2 years 50% - 2007 and - - 7,000 7,088 60 51,946
2006 2008 revenue and
operating margin
2 April 23, 13 2,214 3 years 2 years 50% - 2007 and - - 0 1,989 0 2,214
2007 2008 revenue and
operating margin
3 Dec. 19, 268 66,394 3 years 2 years 50% - 2008 and - - 9,450 8,297 0 66,394
2007 2009 revenue and
operating margin
4 Dec. 19, 274 57,250 4 years 0 50% - 2008 and - - 0 7,637 0 57,250
2007 2009 revenue and
operating margin
177,864 0 16,450 25,011 60 177,804
(1) Number of grants cancelled because the targets were not met.
(2) Number of grants after cancellations because the targets were not met.
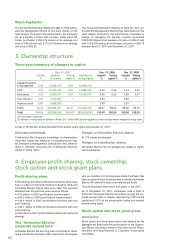
5. Stock market data
In France, Schneider Electric is listed on the Eurolist of the Euronext Paris market (compartment A), where it is traded in lots of
one under ISIN code FR0000121972.
It is part of the market's benchmark CAC 40 index of France's largest stocks.
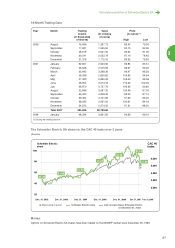
Five-year trading summary
2007 2006 2005 2004 2003
Average daily trading volume
Euronext Paris
- Thousands of shares 1,587.79 1,058.43 947.34 942.82 1,198.06
- Millions of euros 152.00 88.86 59.31 50.49 53.92
High and low share prices (in euros)
- High 110.26 93.40 77.15 58.25 54.30
- Low 83.51 70.85 51.15 49.20 37.40
Year-end closing price (in euros) 92.68 84.10 75.35 51.20 51.90
Yield including tax credit (%) 3.56 3.57 2.99 3.52 3.18