APC 2007 Annual Report Download - page 105
Download and view the complete annual report
Please find page 105 of the 2007 APC annual report below. You can navigate through the pages in the report by either clicking on the pages listed below, or by using the keyword search tool below to find specific information within the annual report.-
 1
1 -
2
-
3
-
4
-
5
-
6
-
7
-
8
-
9
-
10
-
11
-
12
-
13
-
14
-
15
-
16
-
17
-
18
-
19
-
20
-
21
-
22
-
23
-
24
-
25
-
26
-
27
-
28
-
29
-
30
-
31
-
32
-
33
-
34
-
35
-
36
-
37
-
38
-
39
-
40
-
41
-
42
-
43
-
44
-
45
-
46
-
47
-
48
-
49
-
50
-
51
-
52
-
53
-
54
-
55
-
56
-
57
-
58
-
59
-
60
-
61
-
62
-
63
-
64
-
65
-
66
-
67
-
68
-
69
-
70
-
71
-
72
-
73
-
74
-
75
-
76
-
77
-
78
-
79
-
80
-
81
-
82
-
83
-
84
-
85
-
86
-
87
-
88
-
89
-
90
-
91
-
92
-
93
-
94
-
 95
95 -
 96
96 -
 97
97 -
 98
98 -
 99
99 -
 100
100 -
 101
101 -
 102
102 -
 103
103 -
 104
104 -
 105
105 -
 106
106 -
 107
107 -
 108
108 -
 109
109 -
 110
110 -
 111
111 -
 112
112 -
 113
113 -
 114
114 -
 115
115 -
116
-
117
-
118
-
119
-
120
-
121
-
122
-
123
-
124
-
125
-
126
-
127
-
128
-
129
-
130
-
131
-
132
-
133
-
134
-
135
-
136
-
137
-
138
-
139
-
140
-
141
-
142
-
143
-
144
-
145
-
146
-
147
-
148
-
149
-
150
-
151
-
152
-
153
-
154
-
155
-
156
-
157
-
158
-
159
-
160
-
161
-
162
-
163
-
164
-
165
-
166
-
167
-
168
-
169
-
170
-
171
-
172
-
173
-
174
-
175
-
176
-
177
-
178
-
179
-
180
-
181
-
182
-
183
-
184
-
185
-
186
-
187
-
188
-
189
-
190
 |
 |

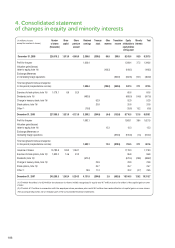
5
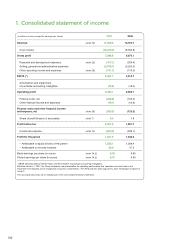
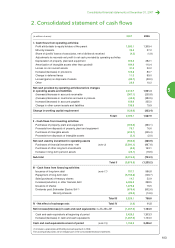
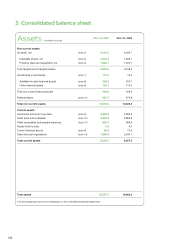
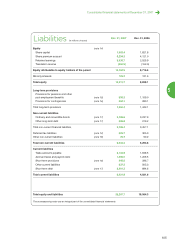
Consolidated financial statements at December 31, 2007
2. Consolidated statement of cash flows
(in millions of euros)
2007 2006
I - Cash flows from operating activities:
Profit attributable to equity holders of the parent 1,583.1 1,309.4
Minority interests 38.4 37.2
Share of (profit)/ losses of associates, net of dividends received (4.3) (1.9)
Adjustments to reconcile net profit to net cash provided by operating activities:
Depreciation of property, plant and equipment 309.4 282.1
Amortization of intangible assets other than goodwill 184.9 110.4
Losses on non current assets 41.2 32.2
Increase/(decrease) in provisions 100.8 80.7
Change in deferred taxes 11.3 99.0
Losses/(gains) on disposals of assets (80.7) (38.0)
Other 26.6 10.2
Net cash provided by operating activities before changes
in operating assets and liabilities 2,210.7 1,921.3
(Increase)/decrease in accounts receivable (367.1) (255.8)
(Increase)/decrease in inventories and work in process (44.0) (382.5)
Increase/(decrease) in accounts payable 150.6 225.0
Change in other current assets and liabilities 139.9 79.9
Change in working capital requirement (120.6) (333.4)
Total I 2,090.1 1,587.9
II - Cash flows from investing activities:
Purchases of property, plant and equipment (403.0) (330.1)
Proceeds from disposals of property, plant and equipment 78.7 76.6
Purchases of intangible assets (232.7) (225.4)
Proceeds from disposals of intangible assets (3.1) (2.0)
Net cash used by investment in operating assets (560.0) (480.9)
Purchases of financial investments - net
(note 3)
(5,291.1) (897.8)
Purchases of other long-term investments (0.3) 163.1
Increase in long-term pension assets (25.1) (19.6)
Sub-total (5,316.5) (754.3)
Total II (5,876.5) (1,235.2)
III - Cash flows from financing activities:
Issuance of long-term debt
(note 17)
707.7 996.8
Repayment of long-term debt (5,159.8) (148.7)
Sale/(purchase) of treasury shares 14.7 52.9
Increase/(reduction) in other financial debt 6,386.0 298.5
Issuance of shares 1,270.8 76.5
Dividends paid: Schneider Electric SA (1) (670.4) (502.6)
Minority interests (28.8) (14.6)
Total III 2,520.1 758.8
IV - Net effect of exchange rate: Total IV (1.6) 11.5
Net increase/(decrease) in cash and cash equivalents: I + II + III + IV (1,267.9) 1,123.0
Cash and cash equivalents at beginning of period 2,426.2 1,303.3
Increase/(decrease) in cash and cash equivalents (1,267.9) 1,123.0
Cash and cash equivalents at end of period
(note 13)
1,158.3 2,426.2
(1) Includes a précompte withholding tax back payment in 2006.
The accompanying notes are an integral part of the consolidated financial statements.
103