APC 2007 Annual Report Download - page 67
Download and view the complete annual report
Please find page 67 of the 2007 APC annual report below. You can navigate through the pages in the report by either clicking on the pages listed below, or by using the keyword search tool below to find specific information within the annual report.-
 1
1 -
2
-
3
-
4
-
5
-
6
-
7
-
8
-
9
-
10
-
11
-
12
-
13
-
14
-
15
-
16
-
17
-
18
-
19
-
20
-
21
-
22
-
23
-
24
-
25
-
26
-
27
-
28
-
29
-
30
-
31
-
32
-
33
-
34
-
35
-
36
-
37
-
38
-
39
-
40
-
41
-
42
-
43
-
44
-
45
-
46
-
47
-
48
-
49
-
50
-
51
-
52
-
53
-
54
-
55
-
56
-
 57
57 -
 58
58 -
 59
59 -
 60
60 -
 61
61 -
 62
62 -
 63
63 -
 64
64 -
 65
65 -
 66
66 -
 67
67 -
 68
68 -
 69
69 -
 70
70 -
 71
71 -
 72
72 -
 73
73 -
 74
74 -
 75
75 -
 76
76 -
 77
77 -
78
-
79
-
80
-
81
-
82
-
83
-
84
-
85
-
86
-
87
-
88
-
89
-
90
-
91
-
92
-
93
-
94
-
95
-
96
-
97
-
98
-
99
-
100
-
101
-
102
-
103
-
104
-
105
-
106
-
107
-
108
-
109
-
110
-
111
-
112
-
113
-
114
-
115
-
116
-
117
-
118
-
119
-
120
-
121
-
122
-
123
-
124
-
125
-
126
-
127
-
128
-
129
-
130
-
131
-
132
-
133
-
134
-
135
-
136
-
137
-
138
-
139
-
140
-
141
-
142
-
143
-
144
-
145
-
146
-
147
-
148
-
149
-
150
-
151
-
152
-
153
-
154
-
155
-
156
-
157
-
158
-
159
-
160
-
161
-
162
-
163
-
164
-
165
-
166
-
167
-
168
-
169
-
170
-
171
-
172
-
173
-
174
-
175
-
176
-
177
-
178
-
179
-
180
-
181
-
182
-
183
-
184
-
185
-
186
-
187
-
188
-
189
-
190
 |
 |

65
3
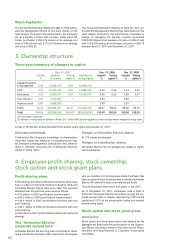
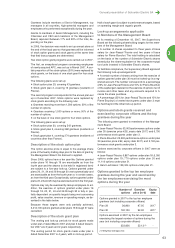
General presentation of Schneider Electric SA
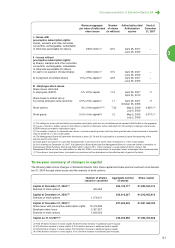
Details on outstanding options (January 1 - March 17, 2007)
Plan Plan Plan Expiration Exercise Total number Options Options Options Options
no. date type date price of shares granted to exercised cancelled outstanding
(1) (in ) that may be corporate during during at
subscribed or officers (2) the year the year March 17,
purchased (2) 2007
16 April 1, 1999 P March 31, 2007 50.73 167,550 0 117,750 27,100 22,700
17 April 1, 1999 P March 31, 2007 50.73 200,143 0 135,743 16,600 47,800
18 March 24, 2000 P March 23, 2008 65.88 358,628 46,000 77,182 0 281,446
19 April 4, 2001 S April 3, 2009 68.80 1,048,458 195,500 63 286 65,370 919,802
20 Dec. 12, 2001 S Dec. 11, 2009 51.76 602,346 89,000 84,300 0 518,046
21 Feb. 5, 2003 S Feb. 4, 2011 45.65 1,439,900 138,000 153,700 11,000 1,275,200
22 Feb. 5, 2003 S Feb. 4, 2011 45.65 59,050 - 15,700 0 43,350
23 May 6, 2004 S May 5, 2012 56.09 52,600 - 2,000 0 50,600
24 May 6, 2004 S May 5, 2012 56.09 1,999,900 150,000 0 93,000 1,906,900
25 May12, 2005 S May11, 2013 57.02 60,050 - 3,150 0 56,900
26 June 28, 2005 S/P June 27, 2013 60.78 1,989,200 200,000 0 1,200 1,988,000
27 Dec. 1, 2005 S/P Nov. 30, 2013 72.10 1,613,700 150,000 0 4,900 1,608,800
28 Dec. 21, 2006 S/P Dec. 20, 2016 82.14 1,257,120 112,000 0 4,600 1,252,520(3)
10,848,645 1,080,500 652,811 223,770 9,972,064
(1) S = Options to subscribe new shares. P = Options to purchase existing shares.
(2) As of January 1, 2007 for plans 16 to 28.
(3) Assuming vesting conditions are met.
Details on outstanding options (March 18 - December 31, 2007)
Plan Plan Plan Expiration Exercise Total number Options Options Options Options
no. date type date price of shares granted to exercised cancelled outstanding
(1) (in ) that may be corporate during during at
subscribed or officers (2) the year the year December 31,
purchased (2) 2007
16 April 1, 1999 P March 31, 2007 50.24 22,927 0 18,887 4,040 0
17 April 1, 1999 P March 31, 2007 50.24 48,276 0 32,116 16,160 0
18 March 24, 2000 P March 23, 2008 65.24 284,401 46,452 102,263 4,624 177,514
19 April 4, 2001 S April 3, 2009 68.13 928,998 197,424 347,001 10,757 571,240
20 Dec. 12, 2001 S Dec. 11, 2009 51.26 527,170 89,869 179,583 1,818 345,769
21 Feb. 5, 2003 S Feb. 4, 2011 45.21 1,287,787 139,344 738,707 12,523 536,557
22 Feb. 5, 2003 S Feb. 4, 2011 45.21 43,784 - 19,153 0 24,631
23 May 6, 2004 S May 5, 2012 55.55 51,106 - 8,652 0 42,454
24 May 6, 2004 S May 5, 2012 55.55 1,925,620 143,078 194,376 13,735 1,717,509
25 May12, 2005 S May 11, 2013 56.47 57,470 - 10,614 0 46,856
26 June 28, 2005 S/P June 27, 2013 60.19 2,007,702 201,961 0 13,938 1,993,764
27 Dec. 1, 2005 S/P Nov. 30, 2013 71.40 1,624,754 151,471 0 11,110 1,613,644
28 Dec. 21, 2006 S/P Dec. 20, 2016 81.34 1,265,034 0 4,808 1,260,226(3)
29 April 23, 2007 S/P April 22, 2017 97.05 83,150(3)
30 Dec. 19, 2007 S/P Dec. 18, 2012 92.00 944,926(3)
10,075,029 969,599 1,651,352 93,513 9,358,240
(1) S = Options to subscribe new shares. P = Options to purchase existing shares.
(2) As of March 18, 2007 for plans 16 to 28, after adjusting for the March 2007 share issue.
(3) Assuming vesting conditions are met.