APC 2007 Annual Report Download - page 95
Download and view the complete annual report
Please find page 95 of the 2007 APC annual report below. You can navigate through the pages in the report by either clicking on the pages listed below, or by using the keyword search tool below to find specific information within the annual report.-
 1
1 -
2
-
3
-
4
-
5
-
6
-
7
-
8
-
9
-
10
-
11
-
12
-
13
-
14
-
15
-
16
-
17
-
18
-
19
-
20
-
21
-
22
-
23
-
24
-
25
-
26
-
27
-
28
-
29
-
30
-
31
-
32
-
33
-
34
-
35
-
36
-
37
-
38
-
39
-
40
-
41
-
42
-
43
-
44
-
45
-
46
-
47
-
48
-
49
-
50
-
51
-
52
-
53
-
54
-
55
-
56
-
57
-
58
-
59
-
60
-
61
-
62
-
63
-
64
-
65
-
66
-
67
-
68
-
69
-
70
-
71
-
72
-
73
-
74
-
75
-
76
-
77
-
78
-
79
-
80
-
81
-
82
-
83
-
84
-
 85
85 -
 86
86 -
 87
87 -
 88
88 -
 89
89 -
 90
90 -
 91
91 -
 92
92 -
 93
93 -
 94
94 -
 95
95 -
 96
96 -
 97
97 -
 98
98 -
 99
99 -
 100
100 -
 101
101 -
 102
102 -
 103
103 -
 104
104 -
 105
105 -
106
-
107
-
108
-
109
-
110
-
111
-
112
-
113
-
114
-
115
-
116
-
117
-
118
-
119
-
120
-
121
-
122
-
123
-
124
-
125
-
126
-
127
-
128
-
129
-
130
-
131
-
132
-
133
-
134
-
135
-
136
-
137
-
138
-
139
-
140
-
141
-
142
-
143
-
144
-
145
-
146
-
147
-
148
-
149
-
150
-
151
-
152
-
153
-
154
-
155
-
156
-
157
-
158
-
159
-
160
-
161
-
162
-
163
-
164
-
165
-
166
-
167
-
168
-
169
-
170
-
171
-
172
-
173
-
174
-
175
-
176
-
177
-
178
-
179
-
180
-
181
-
182
-
183
-
184
-
185
-
186
-
187
-
188
-
189
-
190
 |
 |

93
4
Business review
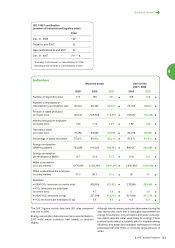
ISO 14001 certification
(number of industrial and logistics sites)
Total
Dec. 31, 2006 192*
Target for end-2007 62
New certifications at end-2007 25
Dec. 31, 2007 211**
*Including 5 site closures or consolidations in 2006.
**Including 6 site closures or consolidations in 2007.
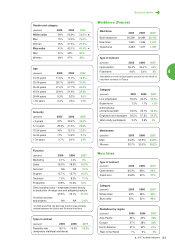
Indicators
Reported scope Like-for-like
2007 / 2006
2005 2006 2007 2006 2007
Number of responding sites 172 184 201 168 168
Number of employees at
manufacturing and logistics sites 50,644 60,462 65,931 55,784 58,812
Amount of waste produced
(in metric tons) 100,547 105,502 119,239 103,557 110,236
Waste produced per employee
(in metric tons) 1.99 1.74 1.81 1.86 1.87
Recovered waste
(in metric tons) 76,286 84,836 95,663 84,136 89,696
Percentage of waste recovered 75.9 % 80.4 % 80.2 % 81.2 % 81.4 %
Energy consumption
(MWh equivalent) 793,898 918,024 968,491 886 617 885,864
Energy consumption
per employee (in MWh) 15.7 15.2 14.7 15.9 15.1
Water consumption
(in cubic meters) 1,874,329 2,122,381 2,461,815 1,950,628 2,001,026
Water consumption per employee
(in cubic meters) 37.0 35.1 37.3 35 34
Estimates
2006 CO2emissions (in metric tons) 285,655 321,823 278,880 283,402
CO2emissions per employee
(in metric tons) 4.7 4.9 54.8
2006 VOC emissions (in kg) 337,548 413,731 351,460 371,728
VOC emissions per employee (in kg) 5.6 6.3 6.3 6.3
The 2007 figures include data from 201 sites compared
with 184 in 2006.
Energy consumption data improved on a reported basis in
2007 while waste indicators held steady or declined
slightly.
Although data for waste production deteriorated during the
year like-for-like, there was a noticeable improvement for
energy consumption, CO2emissions and water consump-
tion (which includes water used solely for cooling). These
positive trends reflect a systemic effort to improve energy
efficiency and adopt best available techniques to reduce
processes that emit VOCs or consume large amounts of
water.
2007 audited indicators