APC 2007 Annual Report Download - page 142
Download and view the complete annual report
Please find page 142 of the 2007 APC annual report below. You can navigate through the pages in the report by either clicking on the pages listed below, or by using the keyword search tool below to find specific information within the annual report.-
 1
1 -
2
-
3
-
4
-
5
-
6
-
7
-
8
-
9
-
10
-
11
-
12
-
13
-
14
-
15
-
16
-
17
-
18
-
19
-
20
-
21
-
22
-
23
-
24
-
25
-
26
-
27
-
28
-
29
-
30
-
31
-
32
-
33
-
34
-
35
-
36
-
37
-
38
-
39
-
40
-
41
-
42
-
43
-
44
-
45
-
46
-
47
-
48
-
49
-
50
-
51
-
52
-
53
-
54
-
55
-
56
-
57
-
58
-
59
-
60
-
61
-
62
-
63
-
64
-
65
-
66
-
67
-
68
-
69
-
70
-
71
-
72
-
73
-
74
-
75
-
76
-
77
-
78
-
79
-
80
-
81
-
82
-
83
-
84
-
85
-
86
-
87
-
88
-
89
-
90
-
91
-
92
-
93
-
94
-
95
-
96
-
97
-
98
-
99
-
100
-
101
-
102
-
103
-
104
-
105
-
106
-
107
-
108
-
109
-
110
-
111
-
112
-
113
-
114
-
115
-
116
-
117
-
118
-
119
-
120
-
121
-
122
-
123
-
124
-
125
-
126
-
127
-
128
-
129
-
130
-
131
-
 132
132 -
 133
133 -
 134
134 -
 135
135 -
 136
136 -
 137
137 -
 138
138 -
 139
139 -
 140
140 -
 141
141 -
 142
142 -
 143
143 -
 144
144 -
 145
145 -
 146
146 -
 147
147 -
 148
148 -
 149
149 -
 150
150 -
 151
151 -
 152
152 -
153
-
154
-
155
-
156
-
157
-
158
-
159
-
160
-
161
-
162
-
163
-
164
-
165
-
166
-
167
-
168
-
169
-
170
-
171
-
172
-
173
-
174
-
175
-
176
-
177
-
178
-
179
-
180
-
181
-
182
-
183
-
184
-
185
-
186
-
187
-
188
-
189
-
190
 |
 |

Note 21 - Related party transactions
21.1 - Associates
These are primarily companies over which the Group has
significant influence. They are accounted for by the equity
method. Transactions with these related parties are carried
out on arm’s length terms.
Related party transactions were not material in 2007.
21.2 - Related parties with
significant influence
No transactions were carried out during the year with
members of the Board of Directors or with Supervisory
Board or Management Board members.
Compensation and benefits paid to the Group’s top senior
executives are described in note 27.3.
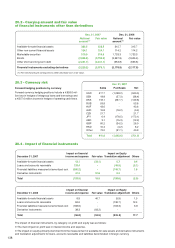
Note 22 - Segment information
First-level segment information is broken down according
to the Group’s four operating divisions on the basis of asset
location. Performance assessments and management de-
cisions are notably based on Earnings Before Interest,
Taxes and Amortization of purchase accounting intangi-
bles (EBITA).
Data by region includes the contribution from Critical
Power. Data concerning General Management that cannot
be allocated to a particular segment are presented under
"Holding". Details are provided in chapter 4 of the Regis-
tration Document (Business Review).
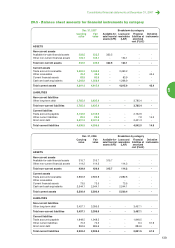
Segment assets include goodwill, net, intangible assets,
net and property, plant and equipment, net, inventories and
work in process, trade accounts receivable and other re-
ceivables. Segment liabilities include short-term provisions
and provision for contingencies, trade accounts payable
and other current liabilities.
December 31, 2007 Europe North Asia- Rest of Holding (1) Total
America Pacific the World
Revenue 7,846 4,770 3,233 1,460 - 17,309
EBITA 1,349 787 440 232 (246) 2,562
Segment Assets 7,956 7,347 3,667 792 423 20,185
of which goodwill 3,379 2,867 1,767 128 - 8,141
Segment Liabilities 2,328 1,204 738 261 891 5,422
Capital employed, gross 327 101 101 6 101 636
(1) Including a
118 million of asset and a
54 million of investment in the SAP core model.
December 31, 2006 Europe North Asia- Rest of Holding (1) Total
America Pacific the World
Revenue 6,402 3,698 2,514 1,116 - 13,730
EBITA 1,137 561 352 190 (221) 2,019
Segment Assets 7,088 4,380 2,336 600 390 14,794
of which goodwill 2,808 2,479 804 95 - 6,186
Segment Liabilities 2,351 1,206 571 198 666 4,992
Capital employed, gross 266 81 97 16 85 545
(1) Including a
93 million of asset and a
52 million of investment in the SAP core model.
Revenue 2007 2006
Electrical Distribution 9,869 8,606
Automation & Control 4,937 4,456
Critical Power 2,503 668
Holding --
17,309 13,730
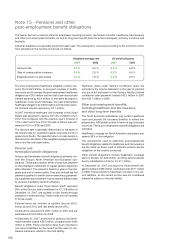
EBITA margin (%) 2007 2006
Electrical Distribution 18.1% 17.3%
Automation & Control 14.2% 14.7%
Critical Power 12.7% 13.9%
Holding -1.4% -1.6%
14.8% 14.7%
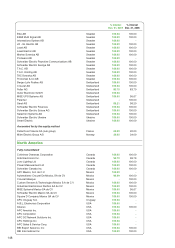
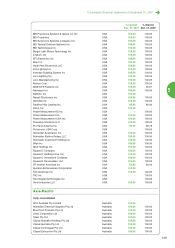
The second level of segment information is broken down according to the Group’s three main businesses.
140